Black/African American vs Immigrants from Norway 4 or more Vehicles in Household
COMPARE
Black/African American
Immigrants from Norway
4 or more Vehicles in Household
4 or more Vehicles in Household Comparison
Blacks/African Americans
Immigrants from Norway
5.5%
4 OR MORE VEHICLES IN HOUSEHOLD
0.6/ 100
METRIC RATING
274th/ 347
METRIC RANK
6.1%
4 OR MORE VEHICLES IN HOUSEHOLD
21.8/ 100
METRIC RATING
199th/ 347
METRIC RANK
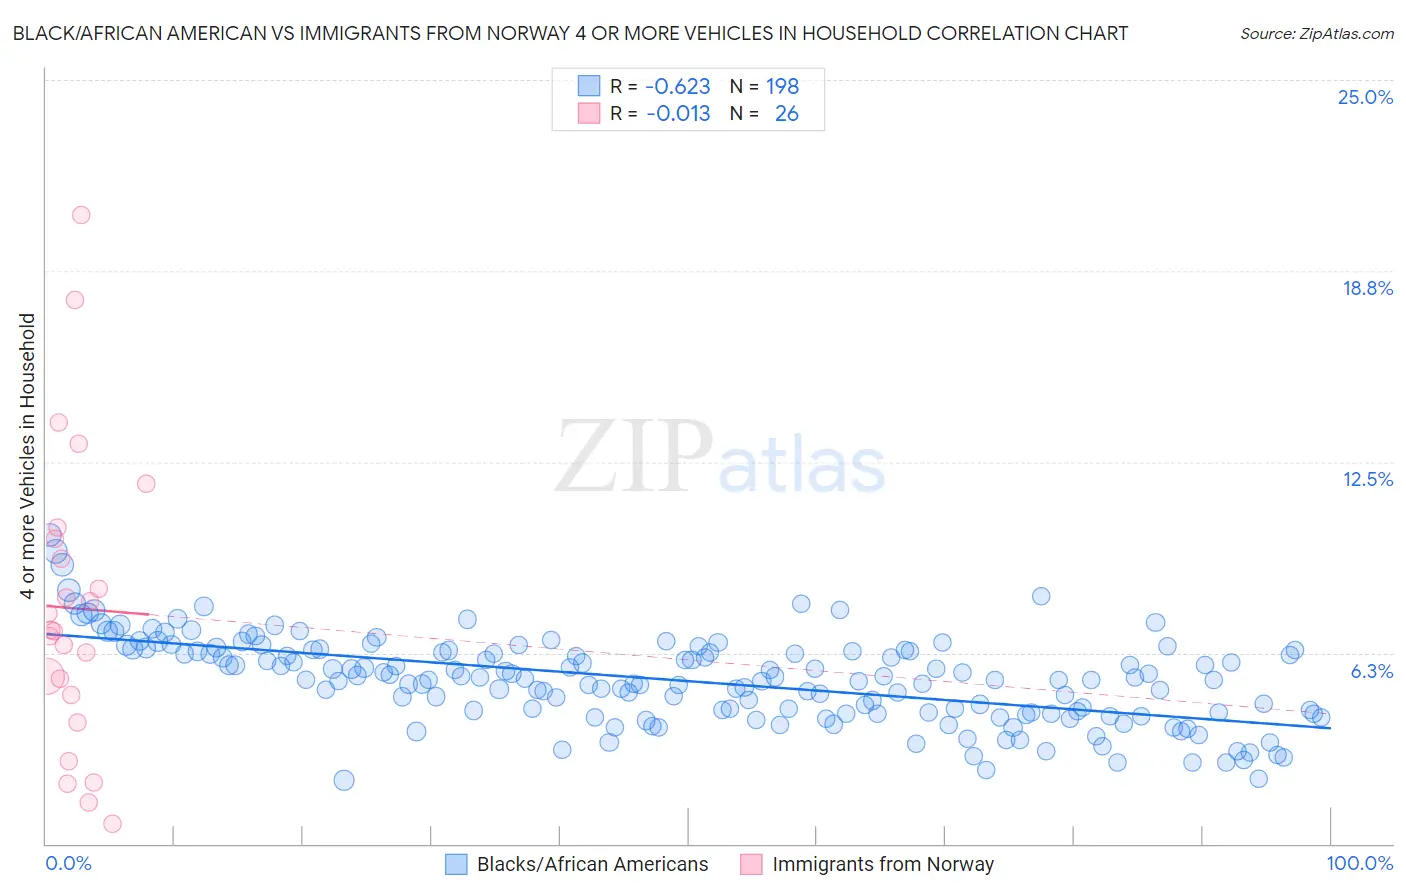
Black/African American vs Immigrants from Norway 4 or more Vehicles in Household Correlation Chart
The statistical analysis conducted on geographies consisting of 562,244,951 people shows a significant negative correlation between the proportion of Blacks/African Americans and percentage of households with 4 or more vehicles available in the United States with a correlation coefficient (R) of -0.623 and weighted average of 5.5%. Similarly, the statistical analysis conducted on geographies consisting of 116,239,195 people shows no correlation between the proportion of Immigrants from Norway and percentage of households with 4 or more vehicles available in the United States with a correlation coefficient (R) of -0.013 and weighted average of 6.1%, a difference of 11.4%.
4 or more Vehicles in Household Correlation Summary
| Measurement | Black/African American | Immigrants from Norway |
| Minimum | 2.1% | 0.66% |
| Maximum | 10.1% | 20.6% |
| Range | 8.0% | 19.9% |
| Mean | 5.3% | 7.7% |
| Median | 5.4% | 7.0% |
| Interquartile 25% (IQ1) | 4.3% | 4.9% |
| Interquartile 75% (IQ3) | 6.3% | 10.0% |
| Interquartile Range (IQR) | 2.0% | 5.1% |
| Standard Deviation (Sample) | 1.4% | 4.8% |
| Standard Deviation (Population) | 1.4% | 4.7% |
Similar Demographics by 4 or more Vehicles in Household
Demographics Similar to Blacks/African Americans by 4 or more Vehicles in Household
In terms of 4 or more vehicles in household, the demographic groups most similar to Blacks/African Americans are Macedonian (5.5%, a difference of 0.12%), Cambodian (5.5%, a difference of 0.12%), Immigrants from Latvia (5.5%, a difference of 0.13%), Immigrants from Kazakhstan (5.5%, a difference of 0.15%), and Immigrants from Bulgaria (5.5%, a difference of 0.25%).
| Demographics | Rating | Rank | 4 or more Vehicles in Household |
| Immigrants | Ukraine | 0.9 /100 | #267 | Tragic 5.6% |
| Colombians | 0.7 /100 | #268 | Tragic 5.5% |
| Carpatho Rusyns | 0.7 /100 | #269 | Tragic 5.5% |
| Okinawans | 0.6 /100 | #270 | Tragic 5.5% |
| Immigrants | Sudan | 0.6 /100 | #271 | Tragic 5.5% |
| Immigrants | Kazakhstan | 0.6 /100 | #272 | Tragic 5.5% |
| Macedonians | 0.6 /100 | #273 | Tragic 5.5% |
| Blacks/African Americans | 0.6 /100 | #274 | Tragic 5.5% |
| Cambodians | 0.5 /100 | #275 | Tragic 5.5% |
| Immigrants | Latvia | 0.5 /100 | #276 | Tragic 5.5% |
| Immigrants | Bulgaria | 0.5 /100 | #277 | Tragic 5.5% |
| Immigrants | Eastern Europe | 0.4 /100 | #278 | Tragic 5.4% |
| Immigrants | Uruguay | 0.3 /100 | #279 | Tragic 5.4% |
| Alsatians | 0.3 /100 | #280 | Tragic 5.4% |
| Immigrants | Western Africa | 0.3 /100 | #281 | Tragic 5.4% |
Demographics Similar to Immigrants from Norway by 4 or more Vehicles in Household
In terms of 4 or more vehicles in household, the demographic groups most similar to Immigrants from Norway are Latvian (6.1%, a difference of 0.0%), Egyptian (6.1%, a difference of 0.060%), Immigrants from South Central Asia (6.1%, a difference of 0.070%), Immigrants from Portugal (6.1%, a difference of 0.080%), and Immigrants from Sierra Leone (6.1%, a difference of 0.20%).
| Demographics | Rating | Rank | 4 or more Vehicles in Household |
| Romanians | 30.7 /100 | #192 | Fair 6.2% |
| Immigrants | Kuwait | 28.0 /100 | #193 | Fair 6.2% |
| Immigrants | Sweden | 27.0 /100 | #194 | Fair 6.2% |
| Argentineans | 27.0 /100 | #195 | Fair 6.2% |
| Tsimshian | 26.4 /100 | #196 | Fair 6.2% |
| Immigrants | Sri Lanka | 23.7 /100 | #197 | Fair 6.1% |
| Immigrants | Portugal | 22.3 /100 | #198 | Fair 6.1% |
| Immigrants | Norway | 21.8 /100 | #199 | Fair 6.1% |
| Latvians | 21.7 /100 | #200 | Fair 6.1% |
| Egyptians | 21.4 /100 | #201 | Fair 6.1% |
| Immigrants | South Central Asia | 21.3 /100 | #202 | Fair 6.1% |
| Immigrants | Sierra Leone | 20.5 /100 | #203 | Fair 6.1% |
| Immigrants | Belize | 19.8 /100 | #204 | Poor 6.1% |
| Hondurans | 19.3 /100 | #205 | Poor 6.1% |
| Kenyans | 18.5 /100 | #206 | Poor 6.1% |