Immigrants from Iran vs Ghanaian No Vehicles in Household
COMPARE
Immigrants from Iran
Ghanaian
No Vehicles in Household
No Vehicles in Household Comparison
Immigrants from Iran
Ghanaians
8.4%
NO VEHICLES IN HOUSEHOLD
99.7/ 100
METRIC RATING
68th/ 347
METRIC RANK
16.4%
NO VEHICLES IN HOUSEHOLD
0.0/ 100
METRIC RATING
316th/ 347
METRIC RANK
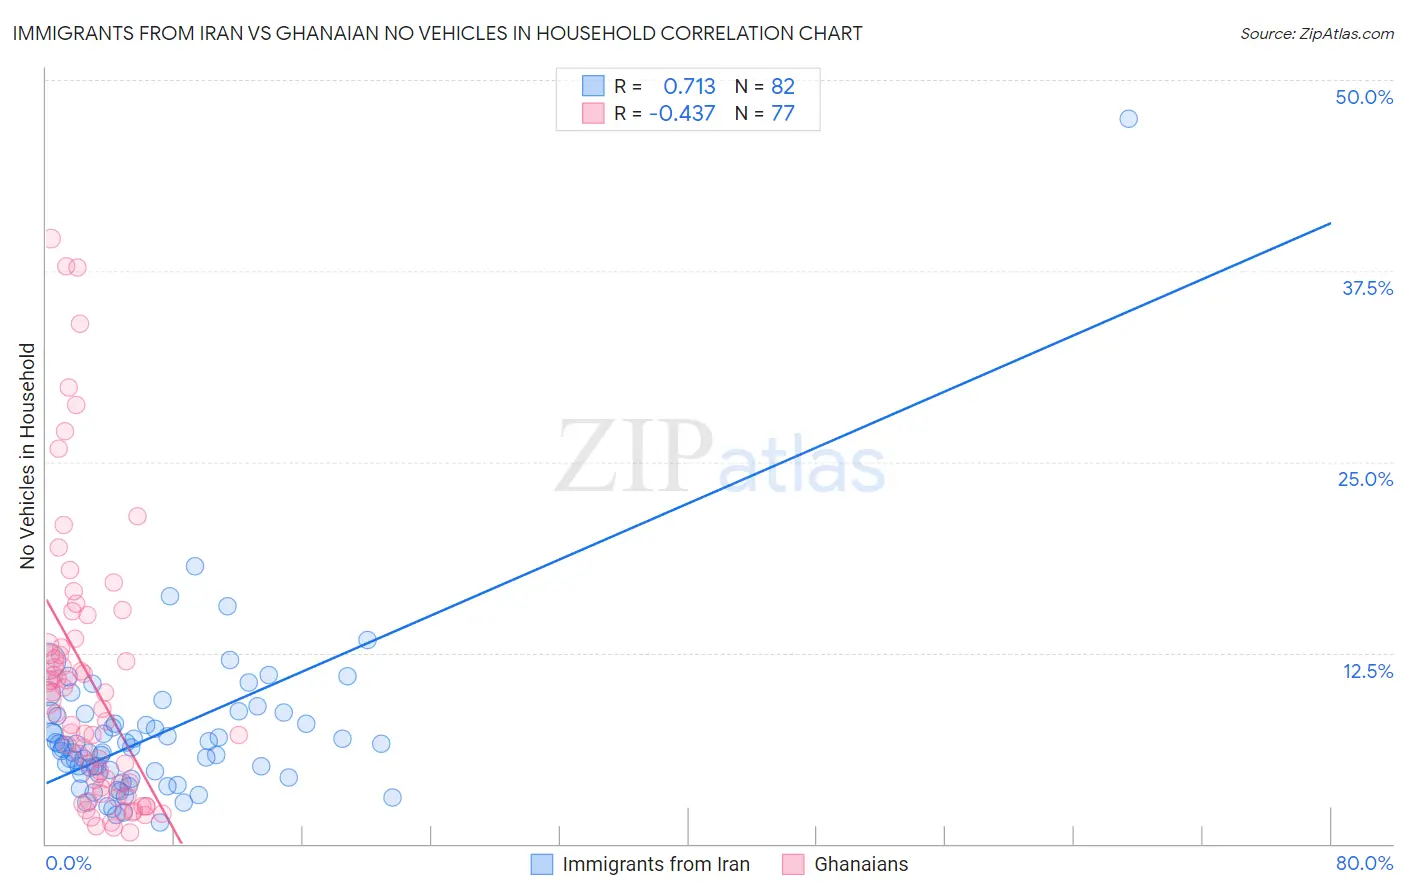
Immigrants from Iran vs Ghanaian No Vehicles in Household Correlation Chart
The statistical analysis conducted on geographies consisting of 279,496,413 people shows a strong positive correlation between the proportion of Immigrants from Iran and percentage of households with no vehicle available in the United States with a correlation coefficient (R) of 0.713 and weighted average of 8.4%. Similarly, the statistical analysis conducted on geographies consisting of 190,166,774 people shows a moderate negative correlation between the proportion of Ghanaians and percentage of households with no vehicle available in the United States with a correlation coefficient (R) of -0.437 and weighted average of 16.4%, a difference of 96.6%.
No Vehicles in Household Correlation Summary
| Measurement | Immigrants from Iran | Ghanaian |
| Minimum | 1.4% | 0.75% |
| Maximum | 47.4% | 39.6% |
| Range | 46.0% | 38.9% |
| Mean | 7.1% | 10.7% |
| Median | 6.3% | 8.9% |
| Interquartile 25% (IQ1) | 4.6% | 3.5% |
| Interquartile 75% (IQ3) | 8.4% | 13.2% |
| Interquartile Range (IQR) | 3.8% | 9.7% |
| Standard Deviation (Sample) | 5.5% | 9.2% |
| Standard Deviation (Population) | 5.5% | 9.2% |
Similar Demographics by No Vehicles in Household
Demographics Similar to Immigrants from Iran by No Vehicles in Household
In terms of no vehicles in household, the demographic groups most similar to Immigrants from Iran are Spaniard (8.4%, a difference of 0.050%), Immigrants from Scotland (8.3%, a difference of 0.40%), Palestinian (8.3%, a difference of 0.41%), Canadian (8.3%, a difference of 0.52%), and Cajun (8.4%, a difference of 0.78%).
| Demographics | Rating | Rank | No Vehicles in Household |
| Thais | 99.8 /100 | #61 | Exceptional 8.2% |
| Chinese | 99.8 /100 | #62 | Exceptional 8.2% |
| Slovaks | 99.8 /100 | #63 | Exceptional 8.3% |
| Croatians | 99.8 /100 | #64 | Exceptional 8.3% |
| Canadians | 99.7 /100 | #65 | Exceptional 8.3% |
| Palestinians | 99.7 /100 | #66 | Exceptional 8.3% |
| Immigrants | Scotland | 99.7 /100 | #67 | Exceptional 8.3% |
| Immigrants | Iran | 99.7 /100 | #68 | Exceptional 8.4% |
| Spaniards | 99.7 /100 | #69 | Exceptional 8.4% |
| Cajuns | 99.6 /100 | #70 | Exceptional 8.4% |
| Immigrants | Lebanon | 99.6 /100 | #71 | Exceptional 8.4% |
| Lithuanians | 99.6 /100 | #72 | Exceptional 8.4% |
| Poles | 99.6 /100 | #73 | Exceptional 8.4% |
| Cubans | 99.5 /100 | #74 | Exceptional 8.5% |
| Jordanians | 99.5 /100 | #75 | Exceptional 8.5% |
Demographics Similar to Ghanaians by No Vehicles in Household
In terms of no vehicles in household, the demographic groups most similar to Ghanaians are Immigrants from Ghana (16.6%, a difference of 0.95%), Immigrants from Belarus (16.7%, a difference of 1.8%), Cypriot (15.7%, a difference of 5.0%), Albanian (15.6%, a difference of 5.1%), and Tohono O'odham (15.6%, a difference of 5.3%).
| Demographics | Rating | Rank | No Vehicles in Household |
| Puerto Ricans | 0.0 /100 | #309 | Tragic 15.5% |
| Cape Verdeans | 0.0 /100 | #310 | Tragic 15.6% |
| Immigrants | Israel | 0.0 /100 | #311 | Tragic 15.6% |
| Alaskan Athabascans | 0.0 /100 | #312 | Tragic 15.6% |
| Tohono O'odham | 0.0 /100 | #313 | Tragic 15.6% |
| Albanians | 0.0 /100 | #314 | Tragic 15.6% |
| Cypriots | 0.0 /100 | #315 | Tragic 15.7% |
| Ghanaians | 0.0 /100 | #316 | Tragic 16.4% |
| Immigrants | Ghana | 0.0 /100 | #317 | Tragic 16.6% |
| Immigrants | Belarus | 0.0 /100 | #318 | Tragic 16.7% |
| Alaska Natives | 0.0 /100 | #319 | Tragic 17.4% |
| Soviet Union | 0.0 /100 | #320 | Tragic 17.4% |
| Jamaicans | 0.0 /100 | #321 | Tragic 17.9% |
| Immigrants | Cabo Verde | 0.0 /100 | #322 | Tragic 18.4% |
| Immigrants | Yemen | 0.0 /100 | #323 | Tragic 19.5% |