Moroccan vs Ghanaian No Vehicles in Household
COMPARE
Moroccan
Ghanaian
No Vehicles in Household
No Vehicles in Household Comparison
Moroccans
Ghanaians
14.7%
NO VEHICLES IN HOUSEHOLD
0.0/ 100
METRIC RATING
298th/ 347
METRIC RANK
16.4%
NO VEHICLES IN HOUSEHOLD
0.0/ 100
METRIC RATING
316th/ 347
METRIC RANK
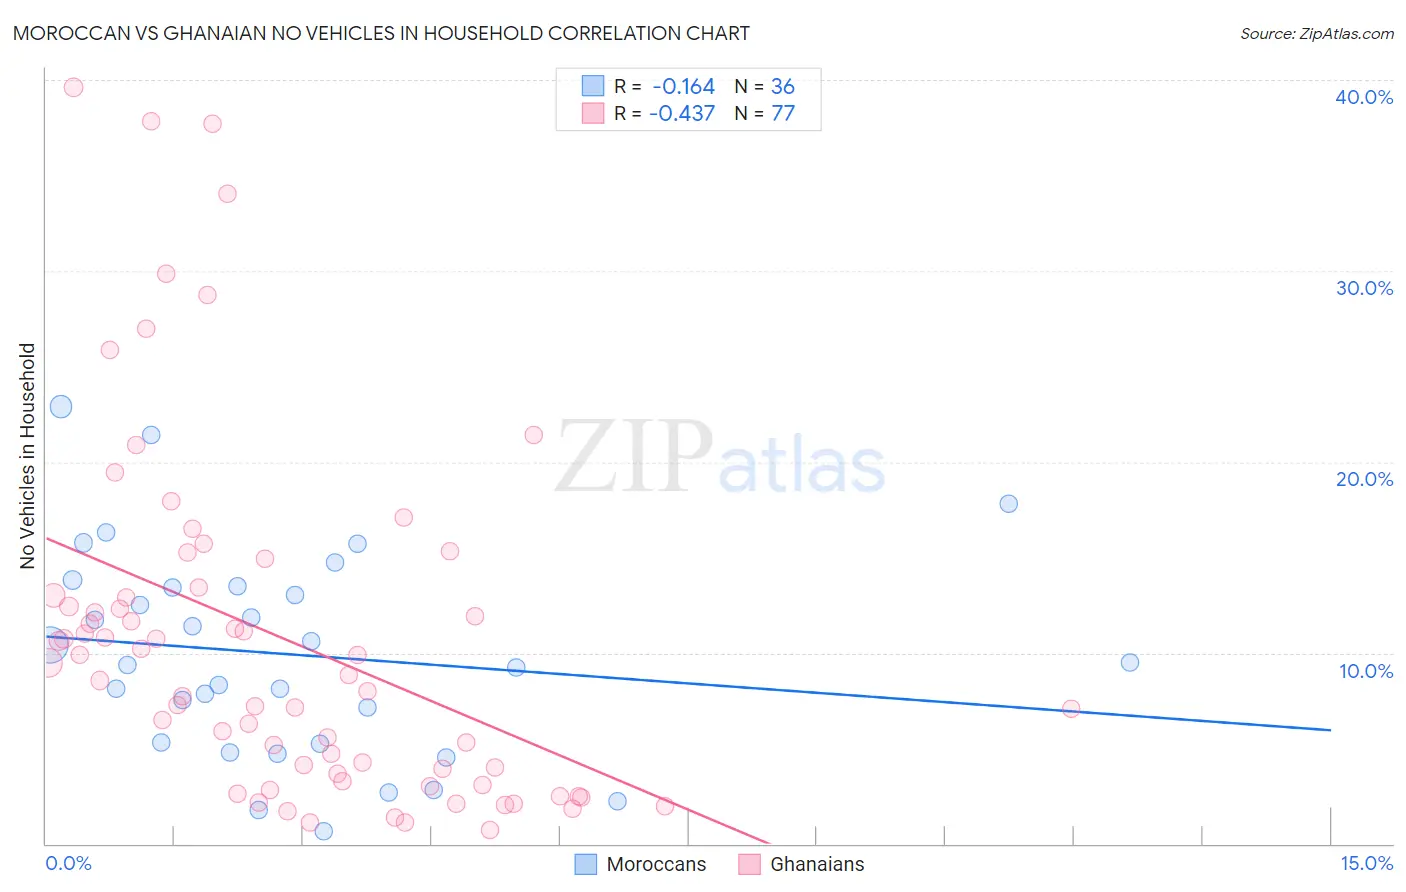
Moroccan vs Ghanaian No Vehicles in Household Correlation Chart
The statistical analysis conducted on geographies consisting of 201,657,116 people shows a poor negative correlation between the proportion of Moroccans and percentage of households with no vehicle available in the United States with a correlation coefficient (R) of -0.164 and weighted average of 14.7%. Similarly, the statistical analysis conducted on geographies consisting of 190,166,774 people shows a moderate negative correlation between the proportion of Ghanaians and percentage of households with no vehicle available in the United States with a correlation coefficient (R) of -0.437 and weighted average of 16.4%, a difference of 12.1%.
No Vehicles in Household Correlation Summary
| Measurement | Moroccan | Ghanaian |
| Minimum | 0.64% | 0.75% |
| Maximum | 22.9% | 39.6% |
| Range | 22.3% | 38.9% |
| Mean | 9.9% | 10.7% |
| Median | 9.4% | 8.9% |
| Interquartile 25% (IQ1) | 5.3% | 3.5% |
| Interquartile 75% (IQ3) | 13.4% | 13.2% |
| Interquartile Range (IQR) | 8.2% | 9.7% |
| Standard Deviation (Sample) | 5.4% | 9.2% |
| Standard Deviation (Population) | 5.4% | 9.2% |
Demographics Similar to Moroccans and Ghanaians by No Vehicles in Household
In terms of no vehicles in household, the demographic groups most similar to Moroccans are Immigrants from Panama (14.6%, a difference of 0.15%), Immigrants from Greece (14.7%, a difference of 0.20%), Yuman (14.9%, a difference of 1.3%), Immigrants from Ukraine (14.9%, a difference of 1.3%), and Haitian (14.9%, a difference of 1.7%). Similarly, the demographic groups most similar to Ghanaians are Immigrants from Ghana (16.6%, a difference of 0.95%), Cypriot (15.7%, a difference of 5.0%), Albanian (15.6%, a difference of 5.1%), Tohono O'odham (15.6%, a difference of 5.3%), and Alaskan Athabascan (15.6%, a difference of 5.4%).
| Demographics | Rating | Rank | No Vehicles in Household |
| Immigrants | Panama | 0.0 /100 | #297 | Tragic 14.6% |
| Moroccans | 0.0 /100 | #298 | Tragic 14.7% |
| Immigrants | Greece | 0.0 /100 | #299 | Tragic 14.7% |
| Yuman | 0.0 /100 | #300 | Tragic 14.9% |
| Immigrants | Ukraine | 0.0 /100 | #301 | Tragic 14.9% |
| Haitians | 0.0 /100 | #302 | Tragic 14.9% |
| Immigrants | Western Africa | 0.0 /100 | #303 | Tragic 15.0% |
| Immigrants | Russia | 0.0 /100 | #304 | Tragic 15.1% |
| Immigrants | China | 0.0 /100 | #305 | Tragic 15.2% |
| Immigrants | Belize | 0.0 /100 | #306 | Tragic 15.4% |
| Immigrants | Haiti | 0.0 /100 | #307 | Tragic 15.4% |
| U.S. Virgin Islanders | 0.0 /100 | #308 | Tragic 15.4% |
| Puerto Ricans | 0.0 /100 | #309 | Tragic 15.5% |
| Cape Verdeans | 0.0 /100 | #310 | Tragic 15.6% |
| Immigrants | Israel | 0.0 /100 | #311 | Tragic 15.6% |
| Alaskan Athabascans | 0.0 /100 | #312 | Tragic 15.6% |
| Tohono O'odham | 0.0 /100 | #313 | Tragic 15.6% |
| Albanians | 0.0 /100 | #314 | Tragic 15.6% |
| Cypriots | 0.0 /100 | #315 | Tragic 15.7% |
| Ghanaians | 0.0 /100 | #316 | Tragic 16.4% |
| Immigrants | Ghana | 0.0 /100 | #317 | Tragic 16.6% |