Choctaw vs Immigrants from Afghanistan 3 or more Vehicles in Household
COMPARE
Choctaw
Immigrants from Afghanistan
3 or more Vehicles in Household
3 or more Vehicles in Household Comparison
Choctaw
Immigrants from Afghanistan
23.0%
3 OR MORE VEHICLES IN HOUSEHOLD
100.0/ 100
METRIC RATING
35th/ 347
METRIC RANK
21.2%
3 OR MORE VEHICLES IN HOUSEHOLD
99.1/ 100
METRIC RATING
90th/ 347
METRIC RANK
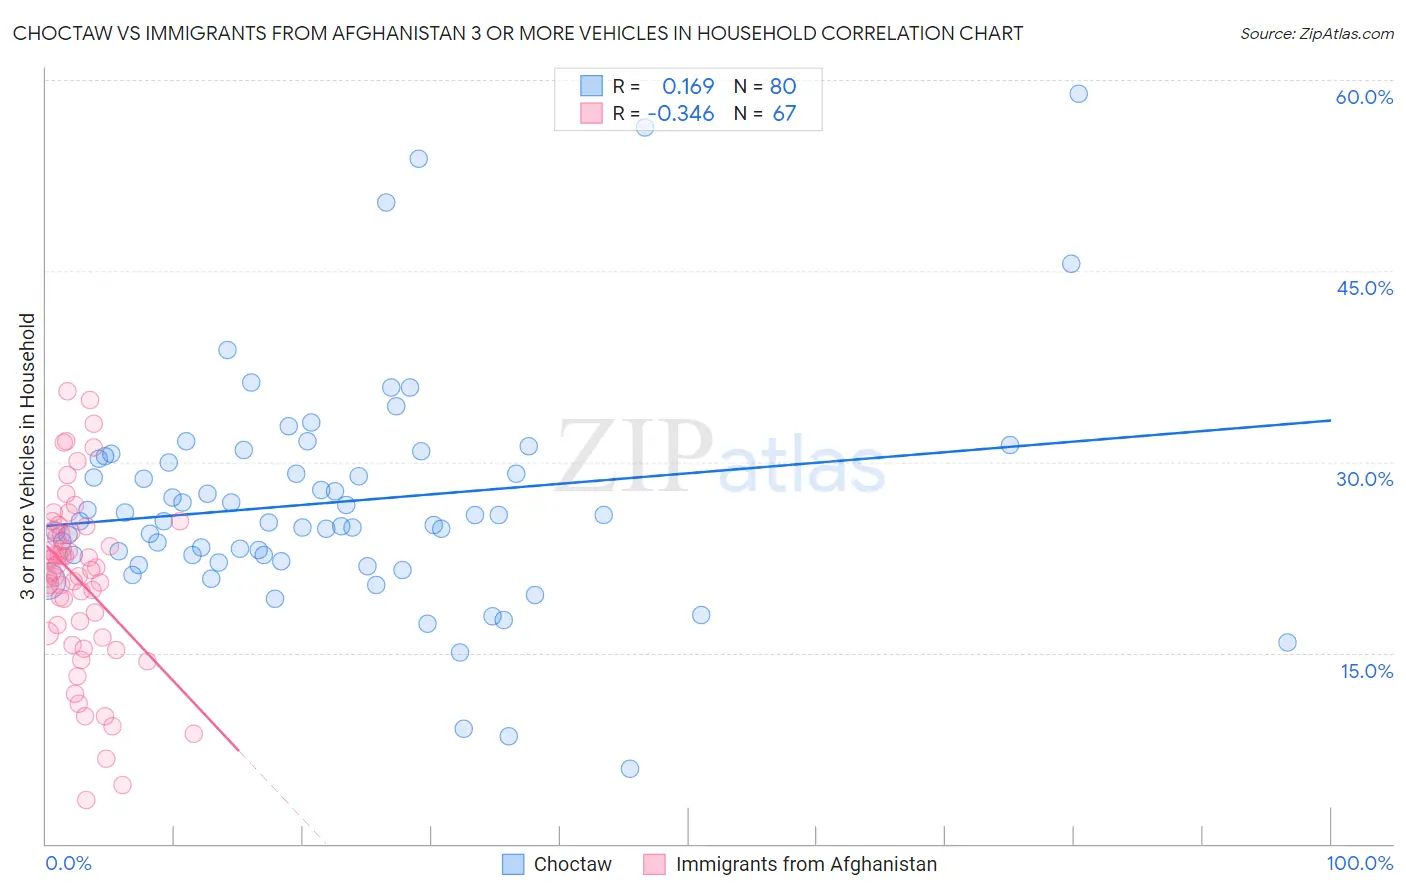
Choctaw vs Immigrants from Afghanistan 3 or more Vehicles in Household Correlation Chart
The statistical analysis conducted on geographies consisting of 269,608,745 people shows a poor positive correlation between the proportion of Choctaw and percentage of households with 3 or more vehicles available in the United States with a correlation coefficient (R) of 0.169 and weighted average of 23.0%. Similarly, the statistical analysis conducted on geographies consisting of 147,579,076 people shows a mild negative correlation between the proportion of Immigrants from Afghanistan and percentage of households with 3 or more vehicles available in the United States with a correlation coefficient (R) of -0.346 and weighted average of 21.2%, a difference of 8.3%.
3 or more Vehicles in Household Correlation Summary
| Measurement | Choctaw | Immigrants from Afghanistan |
| Minimum | 5.9% | 3.4% |
| Maximum | 58.9% | 35.6% |
| Range | 53.0% | 32.2% |
| Mean | 26.8% | 20.7% |
| Median | 25.3% | 21.5% |
| Interquartile 25% (IQ1) | 22.4% | 16.5% |
| Interquartile 75% (IQ3) | 30.4% | 24.6% |
| Interquartile Range (IQR) | 7.9% | 8.1% |
| Standard Deviation (Sample) | 9.1% | 6.9% |
| Standard Deviation (Population) | 9.0% | 6.8% |
Similar Demographics by 3 or more Vehicles in Household
Demographics Similar to Choctaw by 3 or more Vehicles in Household
In terms of 3 or more vehicles in household, the demographic groups most similar to Choctaw are Swiss (23.0%, a difference of 0.020%), Cherokee (23.0%, a difference of 0.040%), Spanish American (23.0%, a difference of 0.070%), Swedish (23.0%, a difference of 0.070%), and Pueblo (23.0%, a difference of 0.13%).
| Demographics | Rating | Rank | 3 or more Vehicles in Household |
| Lumbee | 100.0 /100 | #28 | Exceptional 23.1% |
| Spanish | 100.0 /100 | #29 | Exceptional 23.1% |
| Immigrants | South Eastern Asia | 100.0 /100 | #30 | Exceptional 23.1% |
| English | 100.0 /100 | #31 | Exceptional 23.1% |
| Pueblo | 100.0 /100 | #32 | Exceptional 23.0% |
| Spanish Americans | 100.0 /100 | #33 | Exceptional 23.0% |
| Swiss | 100.0 /100 | #34 | Exceptional 23.0% |
| Choctaw | 100.0 /100 | #35 | Exceptional 23.0% |
| Cherokee | 100.0 /100 | #36 | Exceptional 23.0% |
| Swedes | 100.0 /100 | #37 | Exceptional 23.0% |
| Dutch | 100.0 /100 | #38 | Exceptional 22.9% |
| Yaqui | 100.0 /100 | #39 | Exceptional 22.9% |
| Europeans | 100.0 /100 | #40 | Exceptional 22.9% |
| Germans | 100.0 /100 | #41 | Exceptional 22.7% |
| Natives/Alaskans | 100.0 /100 | #42 | Exceptional 22.7% |
Demographics Similar to Immigrants from Afghanistan by 3 or more Vehicles in Household
In terms of 3 or more vehicles in household, the demographic groups most similar to Immigrants from Afghanistan are Marshallese (21.3%, a difference of 0.22%), Belgian (21.2%, a difference of 0.33%), Apache (21.2%, a difference of 0.41%), Immigrants from Indonesia (21.1%, a difference of 0.61%), and French (21.4%, a difference of 0.78%).
| Demographics | Rating | Rank | 3 or more Vehicles in Household |
| Chippewa | 99.6 /100 | #83 | Exceptional 21.5% |
| Icelanders | 99.6 /100 | #84 | Exceptional 21.5% |
| Laotians | 99.6 /100 | #85 | Exceptional 21.5% |
| Delaware | 99.6 /100 | #86 | Exceptional 21.5% |
| Immigrants | Azores | 99.5 /100 | #87 | Exceptional 21.5% |
| French | 99.4 /100 | #88 | Exceptional 21.4% |
| Marshallese | 99.2 /100 | #89 | Exceptional 21.3% |
| Immigrants | Afghanistan | 99.1 /100 | #90 | Exceptional 21.2% |
| Belgians | 98.9 /100 | #91 | Exceptional 21.2% |
| Apache | 98.9 /100 | #92 | Exceptional 21.2% |
| Immigrants | Indonesia | 98.8 /100 | #93 | Exceptional 21.1% |
| Immigrants | Cambodia | 98.6 /100 | #94 | Exceptional 21.1% |
| Pakistanis | 98.5 /100 | #95 | Exceptional 21.0% |
| Cree | 98.4 /100 | #96 | Exceptional 21.0% |
| Canadians | 98.3 /100 | #97 | Exceptional 21.0% |