Central American Indian vs Somali 6th Grade
COMPARE
Central American Indian
Somali
6th Grade
6th Grade Comparison
Central American Indians
Somalis
95.1%
6TH GRADE
0.0/ 100
METRIC RATING
323rd/ 347
METRIC RANK
96.2%
6TH GRADE
0.1/ 100
METRIC RATING
285th/ 347
METRIC RANK
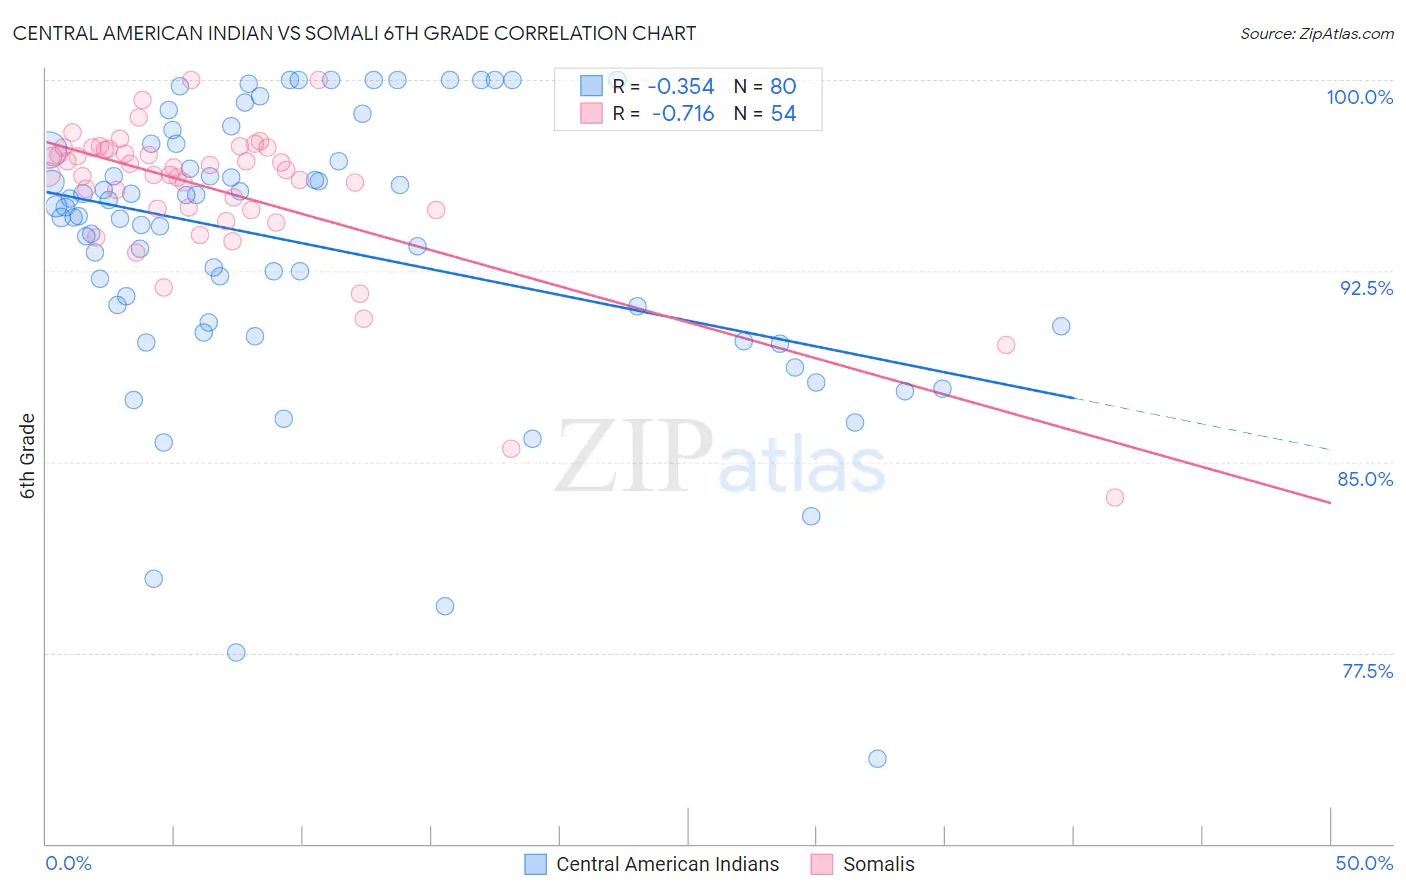
Central American Indian vs Somali 6th Grade Correlation Chart
The statistical analysis conducted on geographies consisting of 326,143,005 people shows a mild negative correlation between the proportion of Central American Indians and percentage of population with at least 6th grade education in the United States with a correlation coefficient (R) of -0.354 and weighted average of 95.1%. Similarly, the statistical analysis conducted on geographies consisting of 99,332,457 people shows a strong negative correlation between the proportion of Somalis and percentage of population with at least 6th grade education in the United States with a correlation coefficient (R) of -0.716 and weighted average of 96.2%, a difference of 1.1%.
6th Grade Correlation Summary
| Measurement | Central American Indian | Somali |
| Minimum | 73.4% | 83.6% |
| Maximum | 100.0% | 100.0% |
| Range | 26.6% | 16.4% |
| Mean | 93.5% | 95.6% |
| Median | 94.8% | 96.4% |
| Interquartile 25% (IQ1) | 90.4% | 94.9% |
| Interquartile 75% (IQ3) | 97.4% | 97.3% |
| Interquartile Range (IQR) | 7.0% | 2.4% |
| Standard Deviation (Sample) | 5.6% | 3.0% |
| Standard Deviation (Population) | 5.5% | 3.0% |
Similar Demographics by 6th Grade
Demographics Similar to Central American Indians by 6th Grade
In terms of 6th grade, the demographic groups most similar to Central American Indians are Immigrants from Cambodia (95.2%, a difference of 0.010%), Cape Verdean (95.1%, a difference of 0.030%), Immigrants from Fiji (95.2%, a difference of 0.060%), Immigrants from Nicaragua (95.1%, a difference of 0.060%), and Immigrants from Ecuador (95.3%, a difference of 0.13%).
| Demographics | Rating | Rank | 6th Grade |
| Japanese | 0.0 /100 | #316 | Tragic 95.4% |
| Vietnamese | 0.0 /100 | #317 | Tragic 95.3% |
| Belizeans | 0.0 /100 | #318 | Tragic 95.3% |
| Immigrants | Belize | 0.0 /100 | #319 | Tragic 95.3% |
| Immigrants | Ecuador | 0.0 /100 | #320 | Tragic 95.3% |
| Immigrants | Fiji | 0.0 /100 | #321 | Tragic 95.2% |
| Immigrants | Cambodia | 0.0 /100 | #322 | Tragic 95.2% |
| Central American Indians | 0.0 /100 | #323 | Tragic 95.1% |
| Cape Verdeans | 0.0 /100 | #324 | Tragic 95.1% |
| Immigrants | Nicaragua | 0.0 /100 | #325 | Tragic 95.1% |
| Hispanics or Latinos | 0.0 /100 | #326 | Tragic 95.0% |
| Mexican American Indians | 0.0 /100 | #327 | Tragic 95.0% |
| Hondurans | 0.0 /100 | #328 | Tragic 95.0% |
| Dominicans | 0.0 /100 | #329 | Tragic 94.9% |
| Nepalese | 0.0 /100 | #330 | Tragic 94.9% |
Demographics Similar to Somalis by 6th Grade
In terms of 6th grade, the demographic groups most similar to Somalis are Fijian (96.2%, a difference of 0.010%), Cuban (96.2%, a difference of 0.020%), Immigrants from Afghanistan (96.2%, a difference of 0.030%), Trinidadian and Tobagonian (96.2%, a difference of 0.030%), and Houma (96.2%, a difference of 0.030%).
| Demographics | Rating | Rank | 6th Grade |
| Immigrants | Thailand | 0.1 /100 | #278 | Tragic 96.3% |
| Immigrants | Peru | 0.1 /100 | #279 | Tragic 96.2% |
| Immigrants | Afghanistan | 0.1 /100 | #280 | Tragic 96.2% |
| Trinidadians and Tobagonians | 0.1 /100 | #281 | Tragic 96.2% |
| Houma | 0.1 /100 | #282 | Tragic 96.2% |
| Cubans | 0.1 /100 | #283 | Tragic 96.2% |
| Fijians | 0.1 /100 | #284 | Tragic 96.2% |
| Somalis | 0.1 /100 | #285 | Tragic 96.2% |
| Barbadians | 0.0 /100 | #286 | Tragic 96.2% |
| Immigrants | Trinidad and Tobago | 0.0 /100 | #287 | Tragic 96.2% |
| Malaysians | 0.0 /100 | #288 | Tragic 96.2% |
| Immigrants | Eritrea | 0.0 /100 | #289 | Tragic 96.1% |
| Immigrants | Somalia | 0.0 /100 | #290 | Tragic 96.1% |
| Immigrants | St. Vincent and the Grenadines | 0.0 /100 | #291 | Tragic 96.1% |
| Immigrants | Barbados | 0.0 /100 | #292 | Tragic 96.1% |