Scandinavian vs Somali 3 or more Vehicles in Household
COMPARE
Scandinavian
Somali
3 or more Vehicles in Household
3 or more Vehicles in Household Comparison
Scandinavians
Somalis
23.6%
3 OR MORE VEHICLES IN HOUSEHOLD
100.0/ 100
METRIC RATING
23rd/ 347
METRIC RANK
16.2%
3 OR MORE VEHICLES IN HOUSEHOLD
0.0/ 100
METRIC RATING
306th/ 347
METRIC RANK
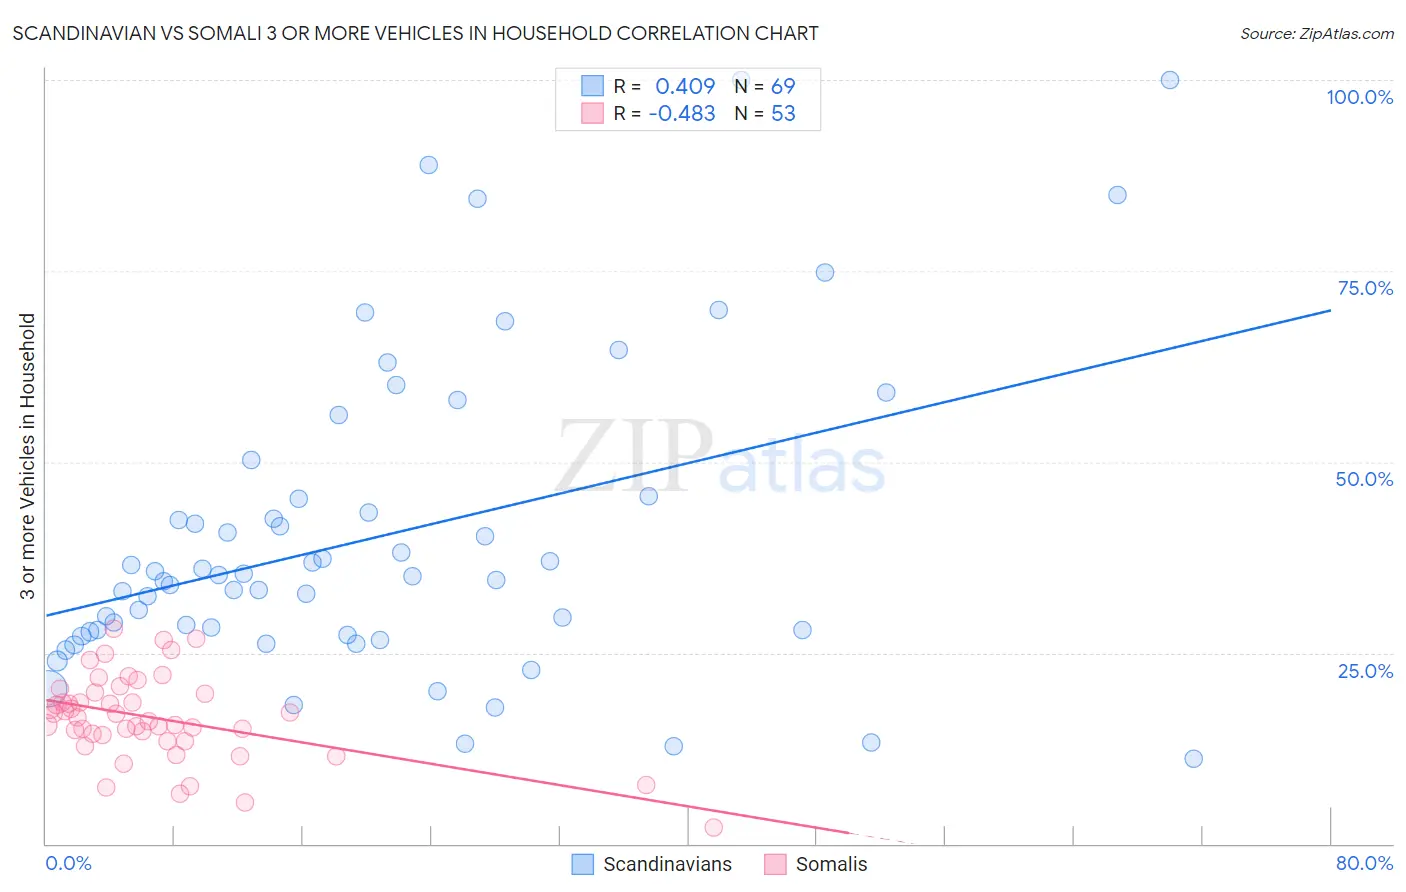
Scandinavian vs Somali 3 or more Vehicles in Household Correlation Chart
The statistical analysis conducted on geographies consisting of 472,159,399 people shows a moderate positive correlation between the proportion of Scandinavians and percentage of households with 3 or more vehicles available in the United States with a correlation coefficient (R) of 0.409 and weighted average of 23.6%. Similarly, the statistical analysis conducted on geographies consisting of 99,282,686 people shows a moderate negative correlation between the proportion of Somalis and percentage of households with 3 or more vehicles available in the United States with a correlation coefficient (R) of -0.483 and weighted average of 16.2%, a difference of 46.0%.
3 or more Vehicles in Household Correlation Summary
| Measurement | Scandinavian | Somali |
| Minimum | 11.1% | 2.2% |
| Maximum | 100.0% | 28.2% |
| Range | 88.9% | 26.0% |
| Mean | 40.3% | 16.5% |
| Median | 35.0% | 16.5% |
| Interquartile 25% (IQ1) | 27.5% | 13.9% |
| Interquartile 75% (IQ3) | 45.3% | 19.8% |
| Interquartile Range (IQR) | 17.8% | 5.9% |
| Standard Deviation (Sample) | 20.4% | 5.5% |
| Standard Deviation (Population) | 20.2% | 5.5% |
Similar Demographics by 3 or more Vehicles in Household
Demographics Similar to Scandinavians by 3 or more Vehicles in Household
In terms of 3 or more vehicles in household, the demographic groups most similar to Scandinavians are Sri Lankan (23.6%, a difference of 0.26%), Immigrants from Philippines (23.8%, a difference of 0.59%), Immigrants from Vietnam (23.8%, a difference of 0.65%), Paiute (23.8%, a difference of 0.77%), and Immigrants from Central America (23.4%, a difference of 0.77%).
| Demographics | Rating | Rank | 3 or more Vehicles in Household |
| Basques | 100.0 /100 | #16 | Exceptional 24.3% |
| Koreans | 100.0 /100 | #17 | Exceptional 24.1% |
| Norwegians | 100.0 /100 | #18 | Exceptional 23.9% |
| Chinese | 100.0 /100 | #19 | Exceptional 23.9% |
| Paiute | 100.0 /100 | #20 | Exceptional 23.8% |
| Immigrants | Vietnam | 100.0 /100 | #21 | Exceptional 23.8% |
| Immigrants | Philippines | 100.0 /100 | #22 | Exceptional 23.8% |
| Scandinavians | 100.0 /100 | #23 | Exceptional 23.6% |
| Sri Lankans | 100.0 /100 | #24 | Exceptional 23.6% |
| Immigrants | Central America | 100.0 /100 | #25 | Exceptional 23.4% |
| Mexican American Indians | 100.0 /100 | #26 | Exceptional 23.3% |
| Guamanians/Chamorros | 100.0 /100 | #27 | Exceptional 23.2% |
| Lumbee | 100.0 /100 | #28 | Exceptional 23.1% |
| Spanish | 100.0 /100 | #29 | Exceptional 23.1% |
| Immigrants | South Eastern Asia | 100.0 /100 | #30 | Exceptional 23.1% |
Demographics Similar to Somalis by 3 or more Vehicles in Household
In terms of 3 or more vehicles in household, the demographic groups most similar to Somalis are Immigrants from Ghana (16.2%, a difference of 0.15%), Houma (16.1%, a difference of 0.74%), Immigrants from Morocco (16.3%, a difference of 0.82%), Ghanaian (16.4%, a difference of 1.1%), and Immigrants from Serbia (16.4%, a difference of 1.6%).
| Demographics | Rating | Rank | 3 or more Vehicles in Household |
| Immigrants | South America | 0.1 /100 | #299 | Tragic 16.7% |
| Cypriots | 0.0 /100 | #300 | Tragic 16.6% |
| Paraguayans | 0.0 /100 | #301 | Tragic 16.6% |
| Immigrants | Greece | 0.0 /100 | #302 | Tragic 16.5% |
| Immigrants | Serbia | 0.0 /100 | #303 | Tragic 16.4% |
| Ghanaians | 0.0 /100 | #304 | Tragic 16.4% |
| Immigrants | Morocco | 0.0 /100 | #305 | Tragic 16.3% |
| Somalis | 0.0 /100 | #306 | Tragic 16.2% |
| Immigrants | Ghana | 0.0 /100 | #307 | Tragic 16.2% |
| Houma | 0.0 /100 | #308 | Tragic 16.1% |
| Immigrants | Somalia | 0.0 /100 | #309 | Tragic 15.9% |
| Moroccans | 0.0 /100 | #310 | Tragic 15.9% |
| Albanians | 0.0 /100 | #311 | Tragic 15.8% |
| Puerto Ricans | 0.0 /100 | #312 | Tragic 15.6% |
| Immigrants | Israel | 0.0 /100 | #313 | Tragic 15.6% |