Spanish American Indian vs Immigrants from Caribbean 3 or more Vehicles in Household
COMPARE
Spanish American Indian
Immigrants from Caribbean
3 or more Vehicles in Household
3 or more Vehicles in Household Comparison
Spanish American Indians
Immigrants from Caribbean
26.9%
3 OR MORE VEHICLES IN HOUSEHOLD
100.0/ 100
METRIC RATING
2nd/ 347
METRIC RANK
14.6%
3 OR MORE VEHICLES IN HOUSEHOLD
0.0/ 100
METRIC RATING
323rd/ 347
METRIC RANK
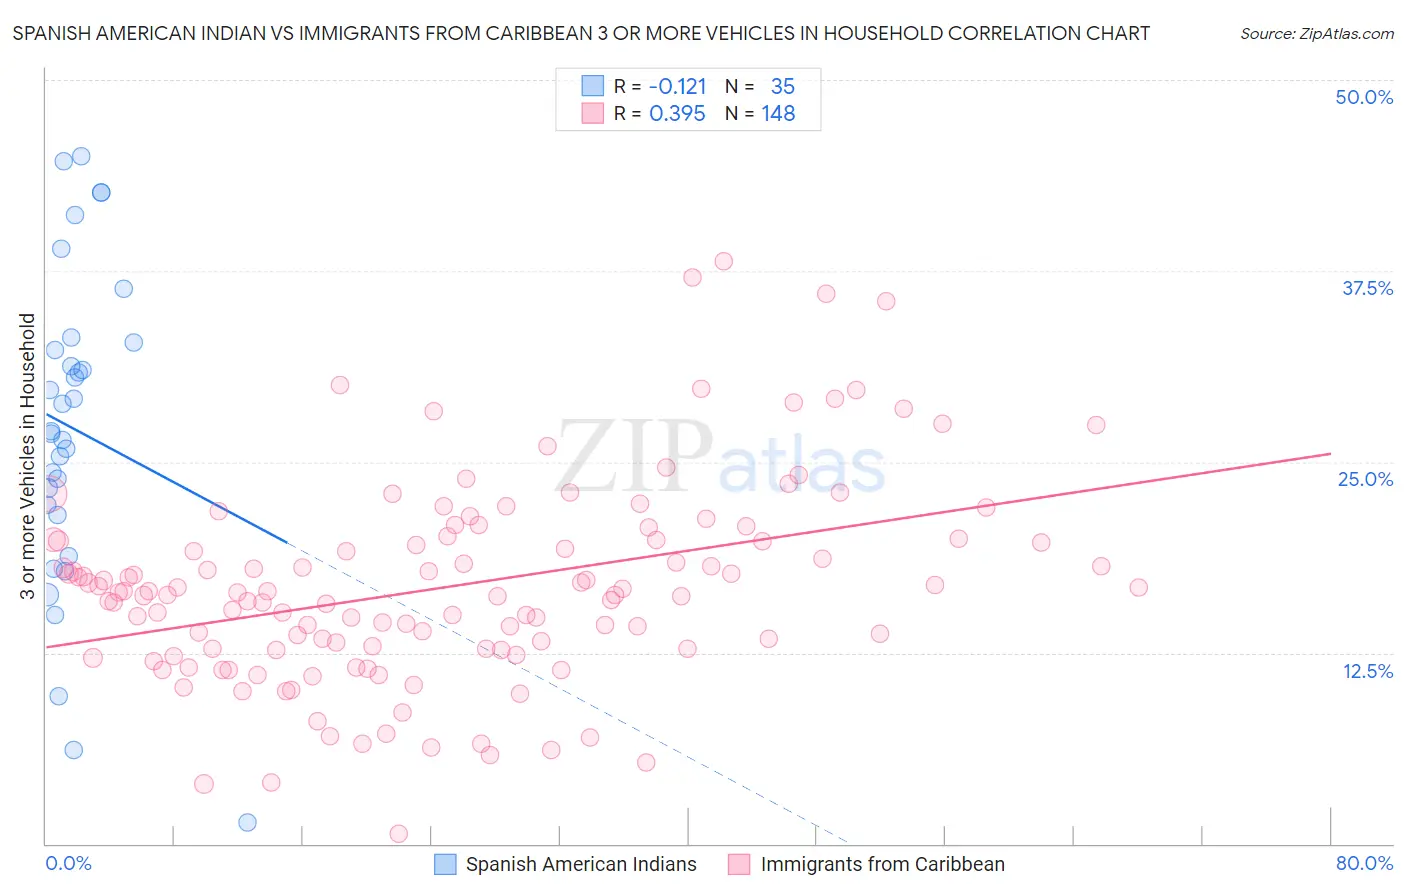
Spanish American Indian vs Immigrants from Caribbean 3 or more Vehicles in Household Correlation Chart
The statistical analysis conducted on geographies consisting of 73,145,550 people shows a poor negative correlation between the proportion of Spanish American Indians and percentage of households with 3 or more vehicles available in the United States with a correlation coefficient (R) of -0.121 and weighted average of 26.9%. Similarly, the statistical analysis conducted on geographies consisting of 449,504,192 people shows a mild positive correlation between the proportion of Immigrants from Caribbean and percentage of households with 3 or more vehicles available in the United States with a correlation coefficient (R) of 0.395 and weighted average of 14.6%, a difference of 84.9%.
3 or more Vehicles in Household Correlation Summary
| Measurement | Spanish American Indian | Immigrants from Caribbean |
| Minimum | 1.4% | 0.62% |
| Maximum | 45.0% | 38.1% |
| Range | 43.6% | 37.5% |
| Mean | 27.2% | 16.8% |
| Median | 27.0% | 16.5% |
| Interquartile 25% (IQ1) | 21.5% | 12.8% |
| Interquartile 75% (IQ3) | 32.8% | 19.9% |
| Interquartile Range (IQR) | 11.3% | 7.1% |
| Standard Deviation (Sample) | 10.4% | 6.6% |
| Standard Deviation (Population) | 10.3% | 6.5% |
Similar Demographics by 3 or more Vehicles in Household
Demographics Similar to Spanish American Indians by 3 or more Vehicles in Household
In terms of 3 or more vehicles in household, the demographic groups most similar to Spanish American Indians are Tongan (26.5%, a difference of 1.5%), Arapaho (26.4%, a difference of 1.8%), Puget Sound Salish (26.4%, a difference of 2.2%), Immigrants from Fiji (26.1%, a difference of 3.4%), and Colville (25.8%, a difference of 4.6%).
| Demographics | Rating | Rank | 3 or more Vehicles in Household |
| Yakama | 100.0 /100 | #1 | Exceptional 31.0% |
| Spanish American Indians | 100.0 /100 | #2 | Exceptional 26.9% |
| Tongans | 100.0 /100 | #3 | Exceptional 26.5% |
| Arapaho | 100.0 /100 | #4 | Exceptional 26.4% |
| Puget Sound Salish | 100.0 /100 | #5 | Exceptional 26.4% |
| Immigrants | Fiji | 100.0 /100 | #6 | Exceptional 26.1% |
| Colville | 100.0 /100 | #7 | Exceptional 25.8% |
| Samoans | 100.0 /100 | #8 | Exceptional 25.0% |
| Native Hawaiians | 100.0 /100 | #9 | Exceptional 24.9% |
| Nepalese | 100.0 /100 | #10 | Exceptional 24.9% |
| Shoshone | 100.0 /100 | #11 | Exceptional 24.9% |
| Danes | 100.0 /100 | #12 | Exceptional 24.7% |
| Mexicans | 100.0 /100 | #13 | Exceptional 24.7% |
| Immigrants | Mexico | 100.0 /100 | #14 | Exceptional 24.6% |
| Hawaiians | 100.0 /100 | #15 | Exceptional 24.3% |
Demographics Similar to Immigrants from Caribbean by 3 or more Vehicles in Household
In terms of 3 or more vehicles in household, the demographic groups most similar to Immigrants from Caribbean are Immigrants from West Indies (14.6%, a difference of 0.44%), Immigrants from Jamaica (14.7%, a difference of 0.75%), Yup'ik (14.8%, a difference of 1.9%), Immigrants from Yemen (14.2%, a difference of 2.3%), and Senegalese (14.2%, a difference of 2.4%).
| Demographics | Rating | Rank | 3 or more Vehicles in Household |
| U.S. Virgin Islanders | 0.0 /100 | #316 | Tragic 15.4% |
| Jamaicans | 0.0 /100 | #317 | Tragic 15.2% |
| Immigrants | Haiti | 0.0 /100 | #318 | Tragic 15.2% |
| Cape Verdeans | 0.0 /100 | #319 | Tragic 15.0% |
| Yup'ik | 0.0 /100 | #320 | Tragic 14.8% |
| Immigrants | Jamaica | 0.0 /100 | #321 | Tragic 14.7% |
| Immigrants | West Indies | 0.0 /100 | #322 | Tragic 14.6% |
| Immigrants | Caribbean | 0.0 /100 | #323 | Tragic 14.6% |
| Immigrants | Yemen | 0.0 /100 | #324 | Tragic 14.2% |
| Senegalese | 0.0 /100 | #325 | Tragic 14.2% |
| Soviet Union | 0.0 /100 | #326 | Tragic 14.2% |
| Ecuadorians | 0.0 /100 | #327 | Tragic 14.1% |
| Immigrants | Albania | 0.0 /100 | #328 | Tragic 14.0% |
| Immigrants | Senegal | 0.0 /100 | #329 | Tragic 13.8% |
| West Indians | 0.0 /100 | #330 | Tragic 13.7% |