Canadian vs Immigrants from Caribbean Child Poverty Among Girls Under 16
COMPARE
Canadian
Immigrants from Caribbean
Child Poverty Among Girls Under 16
Child Poverty Among Girls Under 16 Comparison
Canadians
Immigrants from Caribbean
15.6%
CHILD POVERTY AMONG GIRLS UNDER 16
87.1/ 100
METRIC RATING
142nd/ 347
METRIC RANK
20.7%
CHILD POVERTY AMONG GIRLS UNDER 16
0.0/ 100
METRIC RATING
295th/ 347
METRIC RANK
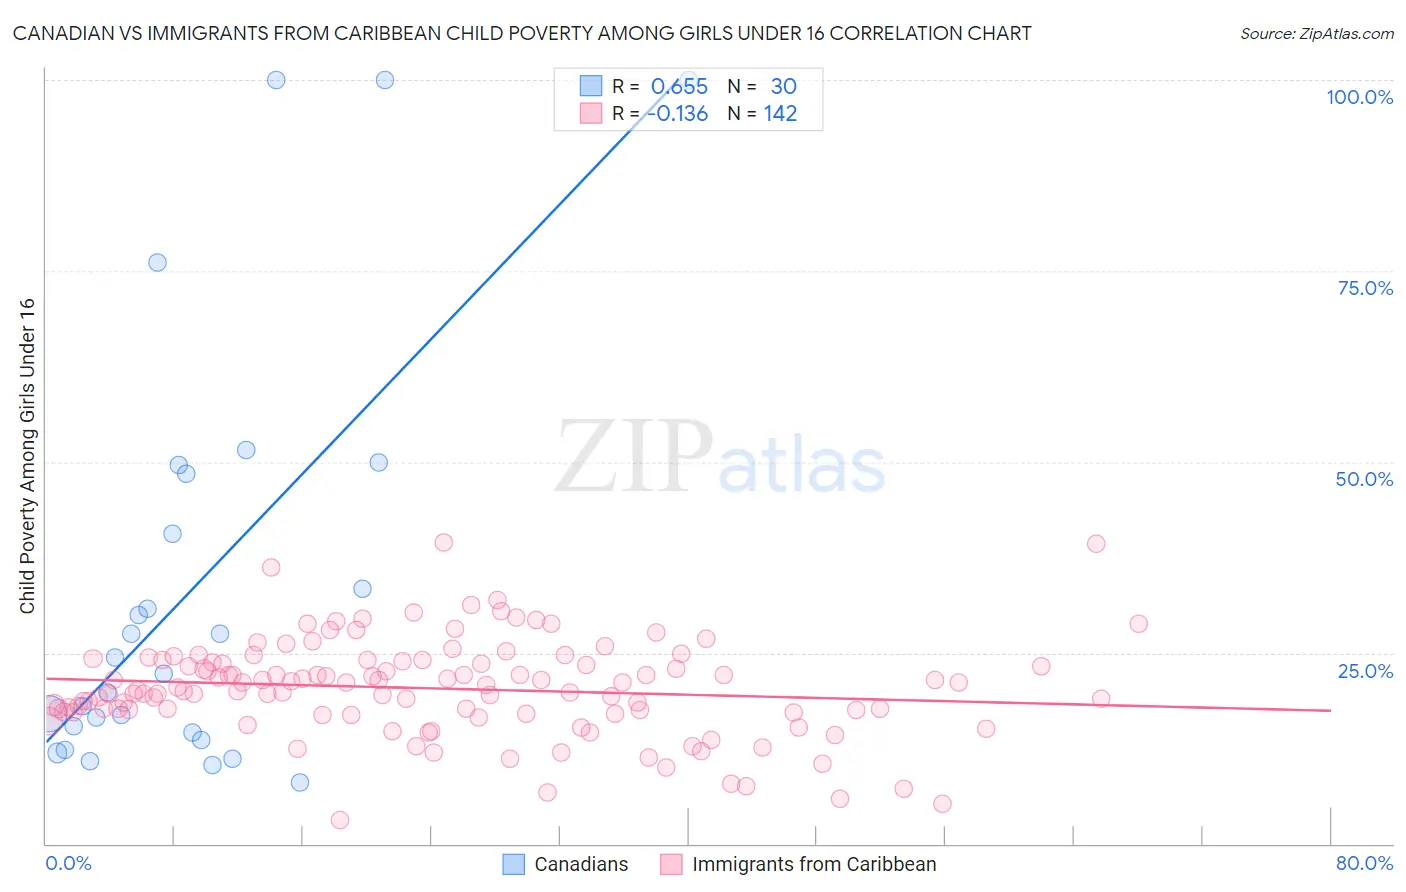
Canadian vs Immigrants from Caribbean Child Poverty Among Girls Under 16 Correlation Chart
The statistical analysis conducted on geographies consisting of 426,709,261 people shows a significant positive correlation between the proportion of Canadians and poverty level among girls under the age of 16 in the United States with a correlation coefficient (R) of 0.655 and weighted average of 15.6%. Similarly, the statistical analysis conducted on geographies consisting of 440,259,837 people shows a poor negative correlation between the proportion of Immigrants from Caribbean and poverty level among girls under the age of 16 in the United States with a correlation coefficient (R) of -0.136 and weighted average of 20.7%, a difference of 32.9%.
Child Poverty Among Girls Under 16 Correlation Summary
| Measurement | Canadian | Immigrants from Caribbean |
| Minimum | 8.1% | 3.2% |
| Maximum | 100.0% | 39.4% |
| Range | 91.9% | 36.3% |
| Mean | 33.6% | 20.3% |
| Median | 23.3% | 20.3% |
| Interquartile 25% (IQ1) | 14.5% | 17.3% |
| Interquartile 75% (IQ3) | 48.4% | 23.9% |
| Interquartile Range (IQR) | 33.9% | 6.7% |
| Standard Deviation (Sample) | 27.5% | 6.2% |
| Standard Deviation (Population) | 27.1% | 6.2% |
Similar Demographics by Child Poverty Among Girls Under 16
Demographics Similar to Canadians by Child Poverty Among Girls Under 16
In terms of child poverty among girls under 16, the demographic groups most similar to Canadians are Immigrants from Jordan (15.6%, a difference of 0.020%), New Zealander (15.6%, a difference of 0.030%), Immigrants from Peru (15.6%, a difference of 0.15%), Armenian (15.5%, a difference of 0.21%), and Israeli (15.6%, a difference of 0.24%).
| Demographics | Rating | Rank | Child Poverty Among Girls Under 16 |
| Czechoslovakians | 89.0 /100 | #135 | Excellent 15.5% |
| Native Hawaiians | 89.0 /100 | #136 | Excellent 15.5% |
| South Africans | 88.7 /100 | #137 | Excellent 15.5% |
| Immigrants | Vietnam | 88.2 /100 | #138 | Excellent 15.5% |
| Armenians | 87.9 /100 | #139 | Excellent 15.5% |
| New Zealanders | 87.2 /100 | #140 | Excellent 15.6% |
| Immigrants | Jordan | 87.2 /100 | #141 | Excellent 15.6% |
| Canadians | 87.1 /100 | #142 | Excellent 15.6% |
| Immigrants | Peru | 86.6 /100 | #143 | Excellent 15.6% |
| Israelis | 86.3 /100 | #144 | Excellent 15.6% |
| Welsh | 85.4 /100 | #145 | Excellent 15.6% |
| Samoans | 84.2 /100 | #146 | Excellent 15.7% |
| Slavs | 83.1 /100 | #147 | Excellent 15.7% |
| Icelanders | 82.4 /100 | #148 | Excellent 15.7% |
| Immigrants | Hungary | 80.9 /100 | #149 | Excellent 15.8% |
Demographics Similar to Immigrants from Caribbean by Child Poverty Among Girls Under 16
In terms of child poverty among girls under 16, the demographic groups most similar to Immigrants from Caribbean are Immigrants from Senegal (20.7%, a difference of 0.030%), Immigrants from Grenada (20.7%, a difference of 0.14%), Immigrants from Latin America (20.6%, a difference of 0.19%), Chippewa (20.6%, a difference of 0.25%), and Immigrants from West Indies (20.7%, a difference of 0.27%).
| Demographics | Rating | Rank | Child Poverty Among Girls Under 16 |
| Haitians | 0.0 /100 | #288 | Tragic 20.5% |
| Immigrants | Belize | 0.0 /100 | #289 | Tragic 20.6% |
| Immigrants | Haiti | 0.0 /100 | #290 | Tragic 20.6% |
| Chippewa | 0.0 /100 | #291 | Tragic 20.6% |
| Immigrants | Latin America | 0.0 /100 | #292 | Tragic 20.6% |
| Immigrants | Grenada | 0.0 /100 | #293 | Tragic 20.7% |
| Immigrants | Senegal | 0.0 /100 | #294 | Tragic 20.7% |
| Immigrants | Caribbean | 0.0 /100 | #295 | Tragic 20.7% |
| Immigrants | West Indies | 0.0 /100 | #296 | Tragic 20.7% |
| Inupiat | 0.0 /100 | #297 | Tragic 20.8% |
| Mexicans | 0.0 /100 | #298 | Tragic 20.9% |
| Hispanics or Latinos | 0.0 /100 | #299 | Tragic 21.0% |
| Somalis | 0.0 /100 | #300 | Tragic 21.0% |
| Choctaw | 0.0 /100 | #301 | Tragic 21.1% |
| Seminole | 0.0 /100 | #302 | Tragic 21.2% |