Vietnamese vs Immigrants from Caribbean 3 or more Vehicles in Household
COMPARE
Vietnamese
Immigrants from Caribbean
3 or more Vehicles in Household
3 or more Vehicles in Household Comparison
Vietnamese
Immigrants from Caribbean
12.5%
3 OR MORE VEHICLES IN HOUSEHOLD
0.0/ 100
METRIC RATING
338th/ 347
METRIC RANK
14.6%
3 OR MORE VEHICLES IN HOUSEHOLD
0.0/ 100
METRIC RATING
323rd/ 347
METRIC RANK
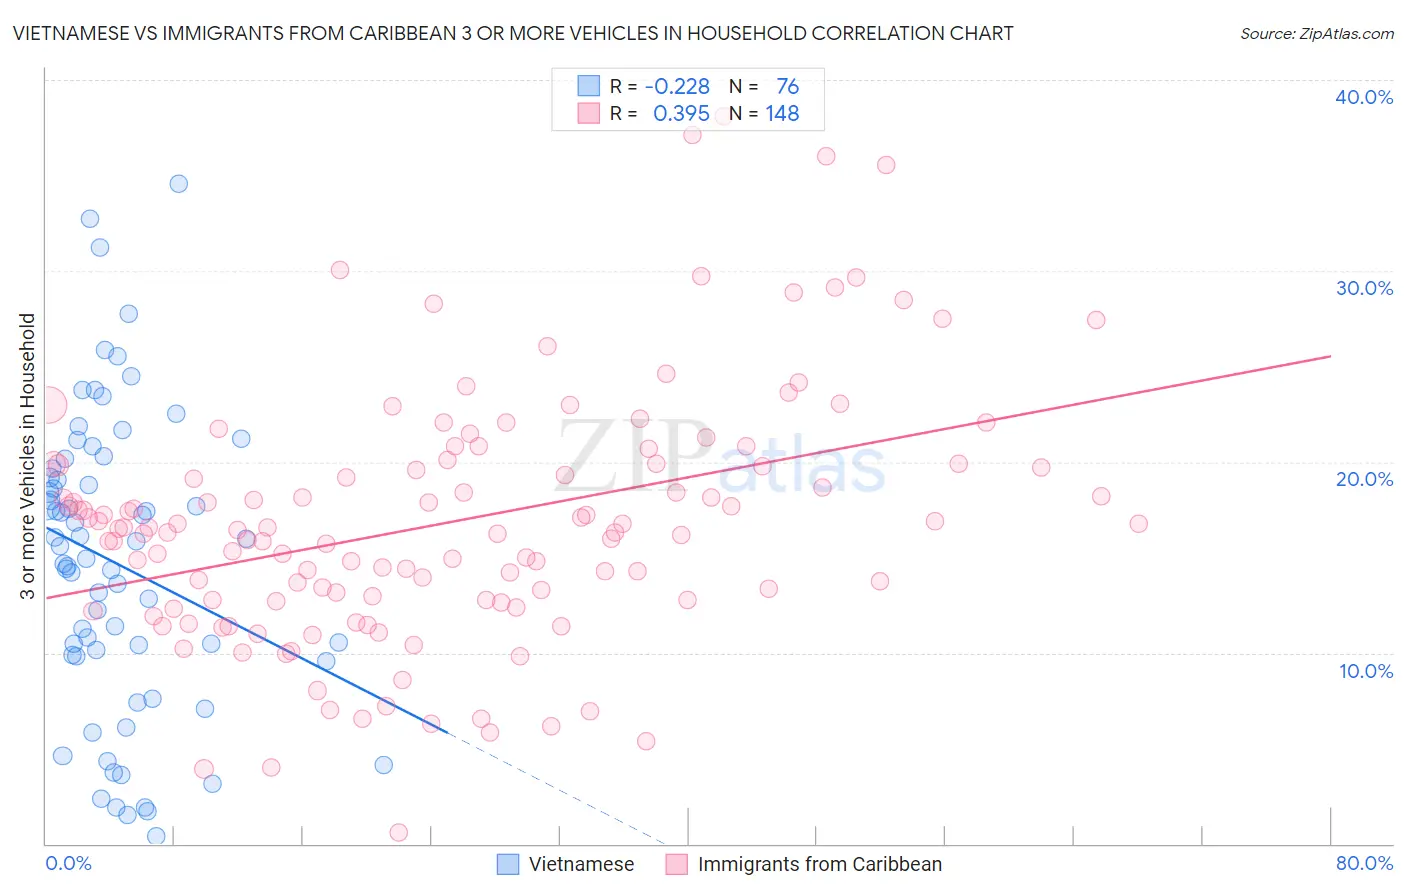
Vietnamese vs Immigrants from Caribbean 3 or more Vehicles in Household Correlation Chart
The statistical analysis conducted on geographies consisting of 170,612,535 people shows a weak negative correlation between the proportion of Vietnamese and percentage of households with 3 or more vehicles available in the United States with a correlation coefficient (R) of -0.228 and weighted average of 12.5%. Similarly, the statistical analysis conducted on geographies consisting of 449,504,192 people shows a mild positive correlation between the proportion of Immigrants from Caribbean and percentage of households with 3 or more vehicles available in the United States with a correlation coefficient (R) of 0.395 and weighted average of 14.6%, a difference of 17.0%.
3 or more Vehicles in Household Correlation Summary
| Measurement | Vietnamese | Immigrants from Caribbean |
| Minimum | 0.43% | 0.62% |
| Maximum | 34.6% | 38.1% |
| Range | 34.1% | 37.5% |
| Mean | 14.7% | 16.8% |
| Median | 15.2% | 16.5% |
| Interquartile 25% (IQ1) | 9.9% | 12.8% |
| Interquartile 75% (IQ3) | 19.4% | 19.9% |
| Interquartile Range (IQR) | 9.6% | 7.1% |
| Standard Deviation (Sample) | 7.8% | 6.6% |
| Standard Deviation (Population) | 7.7% | 6.5% |
Demographics Similar to Vietnamese and Immigrants from Caribbean by 3 or more Vehicles in Household
In terms of 3 or more vehicles in household, the demographic groups most similar to Vietnamese are Immigrants from Bangladesh (12.5%, a difference of 0.54%), Barbadian (12.6%, a difference of 0.98%), Immigrants from Uzbekistan (12.0%, a difference of 3.9%), Immigrants from Barbados (11.7%, a difference of 6.2%), and Immigrants from Trinidad and Tobago (13.3%, a difference of 7.1%). Similarly, the demographic groups most similar to Immigrants from Caribbean are Immigrants from West Indies (14.6%, a difference of 0.44%), Immigrants from Jamaica (14.7%, a difference of 0.75%), Yup'ik (14.8%, a difference of 1.9%), Immigrants from Yemen (14.2%, a difference of 2.3%), and Senegalese (14.2%, a difference of 2.4%).
| Demographics | Rating | Rank | 3 or more Vehicles in Household |
| Yup'ik | 0.0 /100 | #320 | Tragic 14.8% |
| Immigrants | Jamaica | 0.0 /100 | #321 | Tragic 14.7% |
| Immigrants | West Indies | 0.0 /100 | #322 | Tragic 14.6% |
| Immigrants | Caribbean | 0.0 /100 | #323 | Tragic 14.6% |
| Immigrants | Yemen | 0.0 /100 | #324 | Tragic 14.2% |
| Senegalese | 0.0 /100 | #325 | Tragic 14.2% |
| Soviet Union | 0.0 /100 | #326 | Tragic 14.2% |
| Ecuadorians | 0.0 /100 | #327 | Tragic 14.1% |
| Immigrants | Albania | 0.0 /100 | #328 | Tragic 14.0% |
| Immigrants | Senegal | 0.0 /100 | #329 | Tragic 13.8% |
| West Indians | 0.0 /100 | #330 | Tragic 13.7% |
| Immigrants | Dominica | 0.0 /100 | #331 | Tragic 13.7% |
| Trinidadians and Tobagonians | 0.0 /100 | #332 | Tragic 13.6% |
| Immigrants | Cabo Verde | 0.0 /100 | #333 | Tragic 13.6% |
| Immigrants | Ecuador | 0.0 /100 | #334 | Tragic 13.4% |
| Immigrants | Trinidad and Tobago | 0.0 /100 | #335 | Tragic 13.3% |
| Barbadians | 0.0 /100 | #336 | Tragic 12.6% |
| Immigrants | Bangladesh | 0.0 /100 | #337 | Tragic 12.5% |
| Vietnamese | 0.0 /100 | #338 | Tragic 12.5% |
| Immigrants | Uzbekistan | 0.0 /100 | #339 | Tragic 12.0% |
| Immigrants | Barbados | 0.0 /100 | #340 | Tragic 11.7% |