Immigrants from England vs Immigrants from Caribbean 3 or more Vehicles in Household
COMPARE
Immigrants from England
Immigrants from Caribbean
3 or more Vehicles in Household
3 or more Vehicles in Household Comparison
Immigrants from England
Immigrants from Caribbean
20.7%
3 OR MORE VEHICLES IN HOUSEHOLD
96.2/ 100
METRIC RATING
113th/ 347
METRIC RANK
14.6%
3 OR MORE VEHICLES IN HOUSEHOLD
0.0/ 100
METRIC RATING
323rd/ 347
METRIC RANK
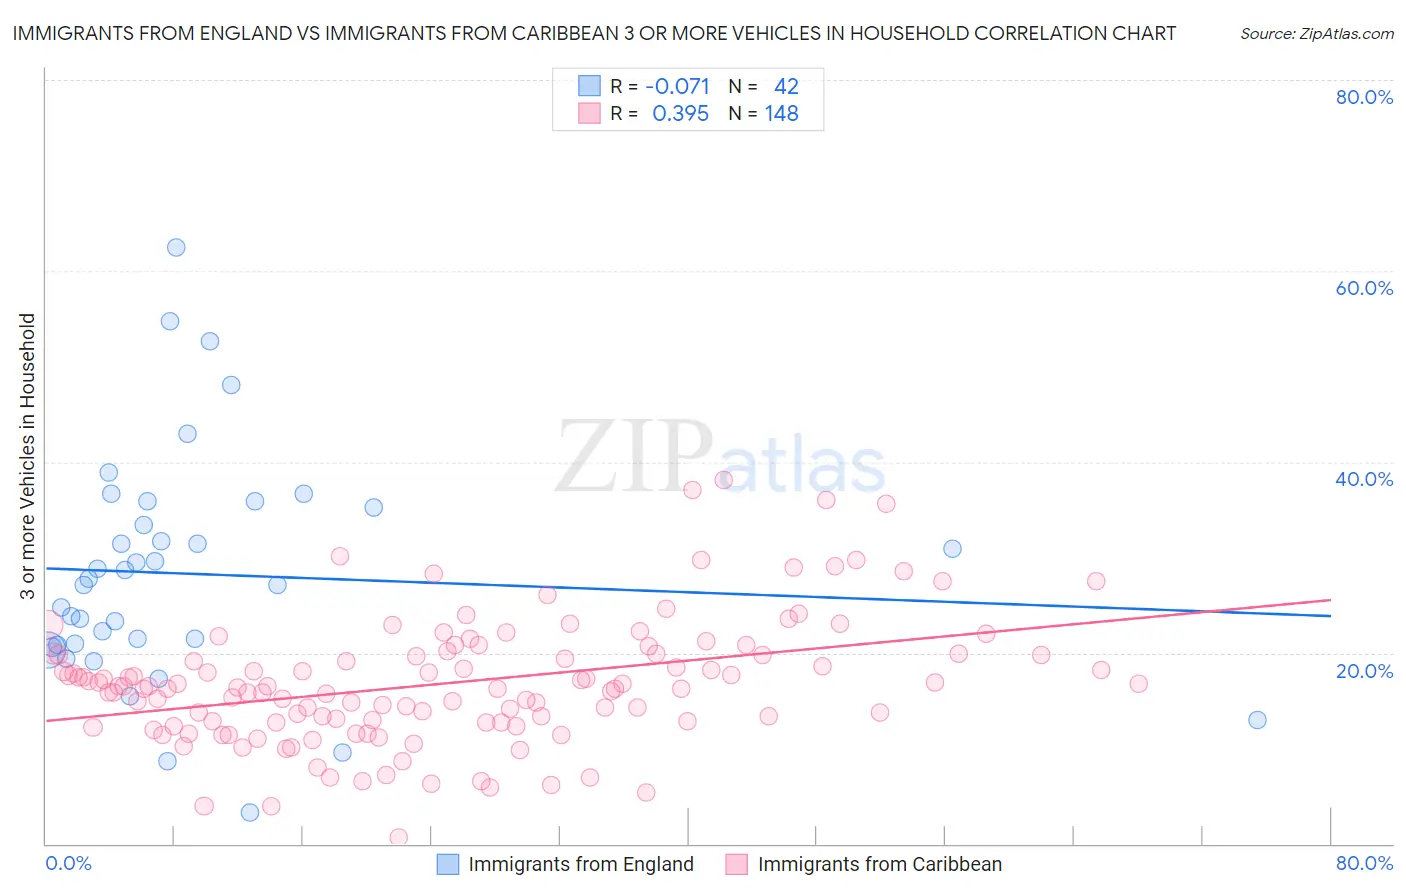
Immigrants from England vs Immigrants from Caribbean 3 or more Vehicles in Household Correlation Chart
The statistical analysis conducted on geographies consisting of 391,649,997 people shows a slight negative correlation between the proportion of Immigrants from England and percentage of households with 3 or more vehicles available in the United States with a correlation coefficient (R) of -0.071 and weighted average of 20.7%. Similarly, the statistical analysis conducted on geographies consisting of 449,504,192 people shows a mild positive correlation between the proportion of Immigrants from Caribbean and percentage of households with 3 or more vehicles available in the United States with a correlation coefficient (R) of 0.395 and weighted average of 14.6%, a difference of 42.0%.
3 or more Vehicles in Household Correlation Summary
| Measurement | Immigrants from England | Immigrants from Caribbean |
| Minimum | 3.3% | 0.62% |
| Maximum | 62.4% | 38.1% |
| Range | 59.1% | 37.5% |
| Mean | 28.2% | 16.8% |
| Median | 27.4% | 16.5% |
| Interquartile 25% (IQ1) | 20.8% | 12.8% |
| Interquartile 75% (IQ3) | 35.2% | 19.9% |
| Interquartile Range (IQR) | 14.4% | 7.1% |
| Standard Deviation (Sample) | 12.1% | 6.6% |
| Standard Deviation (Population) | 12.0% | 6.5% |
Similar Demographics by 3 or more Vehicles in Household
Demographics Similar to Immigrants from England by 3 or more Vehicles in Household
In terms of 3 or more vehicles in household, the demographic groups most similar to Immigrants from England are Nicaraguan (20.7%, a difference of 0.010%), Burmese (20.6%, a difference of 0.18%), Immigrants from Micronesia (20.7%, a difference of 0.30%), Asian (20.8%, a difference of 0.33%), and Filipino (20.8%, a difference of 0.47%).
| Demographics | Rating | Rank | 3 or more Vehicles in Household |
| Bolivians | 97.4 /100 | #106 | Exceptional 20.8% |
| Immigrants | Germany | 97.4 /100 | #107 | Exceptional 20.8% |
| Immigrants | Scotland | 97.1 /100 | #108 | Exceptional 20.8% |
| Filipinos | 97.0 /100 | #109 | Exceptional 20.8% |
| Asians | 96.8 /100 | #110 | Exceptional 20.8% |
| Immigrants | Micronesia | 96.7 /100 | #111 | Exceptional 20.7% |
| Nicaraguans | 96.2 /100 | #112 | Exceptional 20.7% |
| Immigrants | England | 96.2 /100 | #113 | Exceptional 20.7% |
| Burmese | 95.8 /100 | #114 | Exceptional 20.6% |
| French Canadians | 95.0 /100 | #115 | Exceptional 20.6% |
| Italians | 94.9 /100 | #116 | Exceptional 20.6% |
| Croatians | 94.9 /100 | #117 | Exceptional 20.6% |
| Costa Ricans | 94.6 /100 | #118 | Exceptional 20.6% |
| Immigrants | Latin America | 94.5 /100 | #119 | Exceptional 20.5% |
| Maltese | 93.9 /100 | #120 | Exceptional 20.5% |
Demographics Similar to Immigrants from Caribbean by 3 or more Vehicles in Household
In terms of 3 or more vehicles in household, the demographic groups most similar to Immigrants from Caribbean are Immigrants from West Indies (14.6%, a difference of 0.44%), Immigrants from Jamaica (14.7%, a difference of 0.75%), Yup'ik (14.8%, a difference of 1.9%), Immigrants from Yemen (14.2%, a difference of 2.3%), and Senegalese (14.2%, a difference of 2.4%).
| Demographics | Rating | Rank | 3 or more Vehicles in Household |
| U.S. Virgin Islanders | 0.0 /100 | #316 | Tragic 15.4% |
| Jamaicans | 0.0 /100 | #317 | Tragic 15.2% |
| Immigrants | Haiti | 0.0 /100 | #318 | Tragic 15.2% |
| Cape Verdeans | 0.0 /100 | #319 | Tragic 15.0% |
| Yup'ik | 0.0 /100 | #320 | Tragic 14.8% |
| Immigrants | Jamaica | 0.0 /100 | #321 | Tragic 14.7% |
| Immigrants | West Indies | 0.0 /100 | #322 | Tragic 14.6% |
| Immigrants | Caribbean | 0.0 /100 | #323 | Tragic 14.6% |
| Immigrants | Yemen | 0.0 /100 | #324 | Tragic 14.2% |
| Senegalese | 0.0 /100 | #325 | Tragic 14.2% |
| Soviet Union | 0.0 /100 | #326 | Tragic 14.2% |
| Ecuadorians | 0.0 /100 | #327 | Tragic 14.1% |
| Immigrants | Albania | 0.0 /100 | #328 | Tragic 14.0% |
| Immigrants | Senegal | 0.0 /100 | #329 | Tragic 13.8% |
| West Indians | 0.0 /100 | #330 | Tragic 13.7% |