Blackfeet vs Immigrants from Iran 3 or more Vehicles in Household
COMPARE
Blackfeet
Immigrants from Iran
3 or more Vehicles in Household
3 or more Vehicles in Household Comparison
Blackfeet
Immigrants from Iran
20.9%
3 OR MORE VEHICLES IN HOUSEHOLD
97.9/ 100
METRIC RATING
101st/ 347
METRIC RANK
20.0%
3 OR MORE VEHICLES IN HOUSEHOLD
80.9/ 100
METRIC RATING
149th/ 347
METRIC RANK
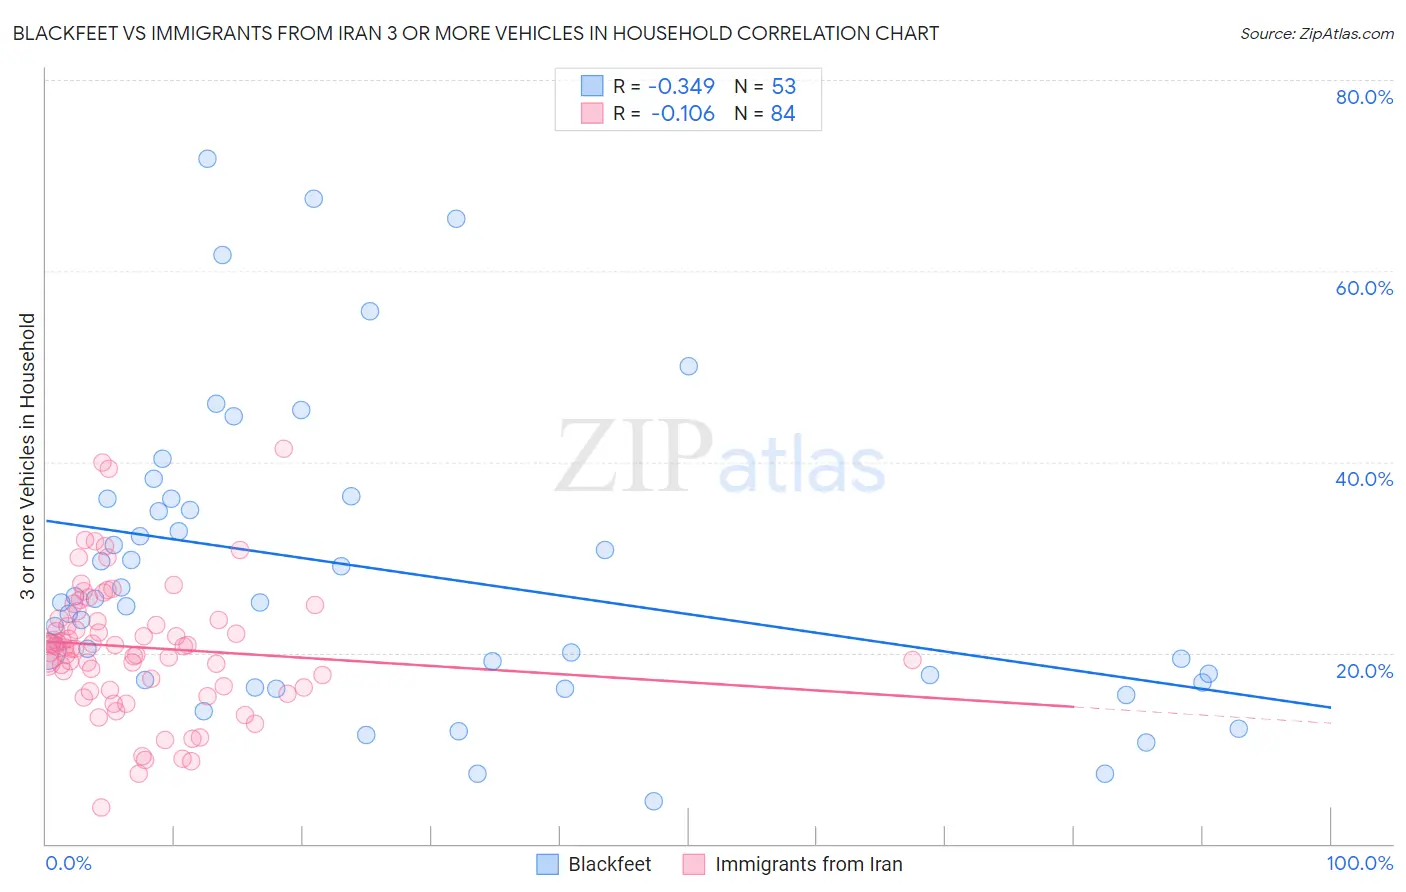
Blackfeet vs Immigrants from Iran 3 or more Vehicles in Household Correlation Chart
The statistical analysis conducted on geographies consisting of 309,447,787 people shows a mild negative correlation between the proportion of Blackfeet and percentage of households with 3 or more vehicles available in the United States with a correlation coefficient (R) of -0.349 and weighted average of 20.9%. Similarly, the statistical analysis conducted on geographies consisting of 279,780,113 people shows a poor negative correlation between the proportion of Immigrants from Iran and percentage of households with 3 or more vehicles available in the United States with a correlation coefficient (R) of -0.106 and weighted average of 20.0%, a difference of 4.4%.
3 or more Vehicles in Household Correlation Summary
| Measurement | Blackfeet | Immigrants from Iran |
| Minimum | 4.5% | 3.8% |
| Maximum | 71.7% | 41.4% |
| Range | 67.2% | 37.6% |
| Mean | 28.6% | 20.6% |
| Median | 25.3% | 20.6% |
| Interquartile 25% (IQ1) | 17.1% | 16.4% |
| Interquartile 75% (IQ3) | 36.1% | 23.5% |
| Interquartile Range (IQR) | 19.1% | 7.1% |
| Standard Deviation (Sample) | 15.8% | 6.9% |
| Standard Deviation (Population) | 15.6% | 6.9% |
Similar Demographics by 3 or more Vehicles in Household
Demographics Similar to Blackfeet by 3 or more Vehicles in Household
In terms of 3 or more vehicles in household, the demographic groups most similar to Blackfeet are Seminole (20.9%, a difference of 0.030%), Dutch West Indian (20.9%, a difference of 0.070%), Luxembourger (20.9%, a difference of 0.15%), Austrian (20.9%, a difference of 0.25%), and Comanche (21.0%, a difference of 0.31%).
| Demographics | Rating | Rank | 3 or more Vehicles in Household |
| Immigrants | Cambodia | 98.6 /100 | #94 | Exceptional 21.1% |
| Pakistanis | 98.5 /100 | #95 | Exceptional 21.0% |
| Cree | 98.4 /100 | #96 | Exceptional 21.0% |
| Canadians | 98.3 /100 | #97 | Exceptional 21.0% |
| Hmong | 98.2 /100 | #98 | Exceptional 21.0% |
| Alaska Natives | 98.2 /100 | #99 | Exceptional 21.0% |
| Comanche | 98.2 /100 | #100 | Exceptional 21.0% |
| Blackfeet | 97.9 /100 | #101 | Exceptional 20.9% |
| Seminole | 97.8 /100 | #102 | Exceptional 20.9% |
| Dutch West Indians | 97.8 /100 | #103 | Exceptional 20.9% |
| Luxembourgers | 97.7 /100 | #104 | Exceptional 20.9% |
| Austrians | 97.5 /100 | #105 | Exceptional 20.9% |
| Bolivians | 97.4 /100 | #106 | Exceptional 20.8% |
| Immigrants | Germany | 97.4 /100 | #107 | Exceptional 20.8% |
| Immigrants | Scotland | 97.1 /100 | #108 | Exceptional 20.8% |
Demographics Similar to Immigrants from Iran by 3 or more Vehicles in Household
In terms of 3 or more vehicles in household, the demographic groups most similar to Immigrants from Iran are Immigrants (20.0%, a difference of 0.020%), Taiwanese (20.0%, a difference of 0.030%), Lebanese (20.0%, a difference of 0.13%), Guatemalan (20.1%, a difference of 0.20%), and Slovak (20.1%, a difference of 0.26%).
| Demographics | Rating | Rank | 3 or more Vehicles in Household |
| Jordanians | 84.4 /100 | #142 | Excellent 20.1% |
| Lithuanians | 84.4 /100 | #143 | Excellent 20.1% |
| Iranians | 84.0 /100 | #144 | Excellent 20.1% |
| Palestinians | 83.9 /100 | #145 | Excellent 20.1% |
| Australians | 83.6 /100 | #146 | Excellent 20.1% |
| Slovaks | 83.0 /100 | #147 | Excellent 20.1% |
| Guatemalans | 82.6 /100 | #148 | Excellent 20.1% |
| Immigrants | Iran | 80.9 /100 | #149 | Excellent 20.0% |
| Immigrants | Immigrants | 80.8 /100 | #150 | Excellent 20.0% |
| Taiwanese | 80.6 /100 | #151 | Excellent 20.0% |
| Lebanese | 79.8 /100 | #152 | Good 20.0% |
| Yuman | 75.6 /100 | #153 | Good 19.9% |
| Immigrants | Jordan | 75.0 /100 | #154 | Good 19.9% |
| Tlingit-Haida | 73.4 /100 | #155 | Good 19.9% |
| Thais | 71.1 /100 | #156 | Good 19.8% |