Blackfeet vs Colombian 3 or more Vehicles in Household
COMPARE
Blackfeet
Colombian
3 or more Vehicles in Household
3 or more Vehicles in Household Comparison
Blackfeet
Colombians
20.9%
3 OR MORE VEHICLES IN HOUSEHOLD
97.9/ 100
METRIC RATING
101st/ 347
METRIC RANK
17.8%
3 OR MORE VEHICLES IN HOUSEHOLD
0.9/ 100
METRIC RATING
262nd/ 347
METRIC RANK
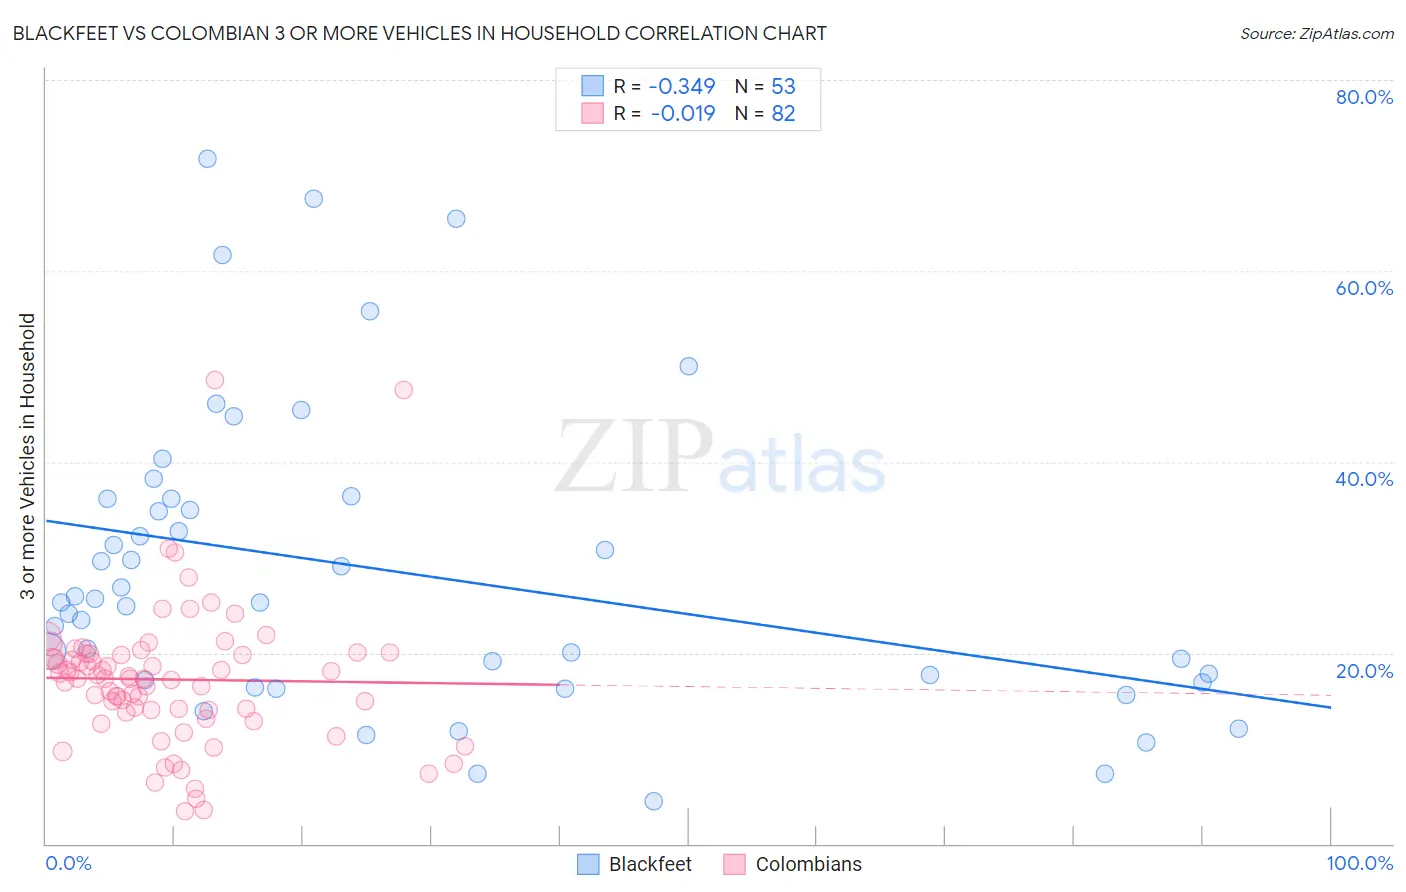
Blackfeet vs Colombian 3 or more Vehicles in Household Correlation Chart
The statistical analysis conducted on geographies consisting of 309,447,787 people shows a mild negative correlation between the proportion of Blackfeet and percentage of households with 3 or more vehicles available in the United States with a correlation coefficient (R) of -0.349 and weighted average of 20.9%. Similarly, the statistical analysis conducted on geographies consisting of 419,151,305 people shows no correlation between the proportion of Colombians and percentage of households with 3 or more vehicles available in the United States with a correlation coefficient (R) of -0.019 and weighted average of 17.8%, a difference of 17.6%.
3 or more Vehicles in Household Correlation Summary
| Measurement | Blackfeet | Colombian |
| Minimum | 4.5% | 3.4% |
| Maximum | 71.7% | 48.6% |
| Range | 67.2% | 45.2% |
| Mean | 28.6% | 17.2% |
| Median | 25.3% | 17.3% |
| Interquartile 25% (IQ1) | 17.1% | 13.9% |
| Interquartile 75% (IQ3) | 36.1% | 19.8% |
| Interquartile Range (IQR) | 19.1% | 5.9% |
| Standard Deviation (Sample) | 15.8% | 7.4% |
| Standard Deviation (Population) | 15.6% | 7.3% |
Similar Demographics by 3 or more Vehicles in Household
Demographics Similar to Blackfeet by 3 or more Vehicles in Household
In terms of 3 or more vehicles in household, the demographic groups most similar to Blackfeet are Seminole (20.9%, a difference of 0.030%), Dutch West Indian (20.9%, a difference of 0.070%), Luxembourger (20.9%, a difference of 0.15%), Austrian (20.9%, a difference of 0.25%), and Comanche (21.0%, a difference of 0.31%).
| Demographics | Rating | Rank | 3 or more Vehicles in Household |
| Immigrants | Cambodia | 98.6 /100 | #94 | Exceptional 21.1% |
| Pakistanis | 98.5 /100 | #95 | Exceptional 21.0% |
| Cree | 98.4 /100 | #96 | Exceptional 21.0% |
| Canadians | 98.3 /100 | #97 | Exceptional 21.0% |
| Hmong | 98.2 /100 | #98 | Exceptional 21.0% |
| Alaska Natives | 98.2 /100 | #99 | Exceptional 21.0% |
| Comanche | 98.2 /100 | #100 | Exceptional 21.0% |
| Blackfeet | 97.9 /100 | #101 | Exceptional 20.9% |
| Seminole | 97.8 /100 | #102 | Exceptional 20.9% |
| Dutch West Indians | 97.8 /100 | #103 | Exceptional 20.9% |
| Luxembourgers | 97.7 /100 | #104 | Exceptional 20.9% |
| Austrians | 97.5 /100 | #105 | Exceptional 20.9% |
| Bolivians | 97.4 /100 | #106 | Exceptional 20.8% |
| Immigrants | Germany | 97.4 /100 | #107 | Exceptional 20.8% |
| Immigrants | Scotland | 97.1 /100 | #108 | Exceptional 20.8% |
Demographics Similar to Colombians by 3 or more Vehicles in Household
In terms of 3 or more vehicles in household, the demographic groups most similar to Colombians are Immigrants from Northern Africa (17.8%, a difference of 0.030%), Ugandan (17.8%, a difference of 0.050%), Bermudan (17.8%, a difference of 0.11%), Cambodian (17.8%, a difference of 0.14%), and Uruguayan (17.8%, a difference of 0.18%).
| Demographics | Rating | Rank | 3 or more Vehicles in Household |
| Immigrants | Turkey | 1.2 /100 | #255 | Tragic 17.9% |
| Sub-Saharan Africans | 1.1 /100 | #256 | Tragic 17.9% |
| Immigrants | Eritrea | 1.1 /100 | #257 | Tragic 17.8% |
| Sudanese | 1.1 /100 | #258 | Tragic 17.8% |
| Uruguayans | 1.0 /100 | #259 | Tragic 17.8% |
| Ugandans | 0.9 /100 | #260 | Tragic 17.8% |
| Immigrants | Northern Africa | 0.9 /100 | #261 | Tragic 17.8% |
| Colombians | 0.9 /100 | #262 | Tragic 17.8% |
| Bermudans | 0.9 /100 | #263 | Tragic 17.8% |
| Cambodians | 0.9 /100 | #264 | Tragic 17.8% |
| Immigrants | Panama | 0.8 /100 | #265 | Tragic 17.7% |
| Macedonians | 0.8 /100 | #266 | Tragic 17.7% |
| Immigrants | Venezuela | 0.8 /100 | #267 | Tragic 17.7% |
| Immigrants | Bulgaria | 0.8 /100 | #268 | Tragic 17.7% |
| Immigrants | France | 0.6 /100 | #269 | Tragic 17.6% |