Blackfeet vs Immigrants from Iran Vision Disability
COMPARE
Blackfeet
Immigrants from Iran
Vision Disability
Vision Disability Comparison
Blackfeet
Immigrants from Iran
2.6%
VISION DISABILITY
0.0/ 100
METRIC RATING
310th/ 347
METRIC RANK
1.8%
VISION DISABILITY
100.0/ 100
METRIC RATING
6th/ 347
METRIC RANK
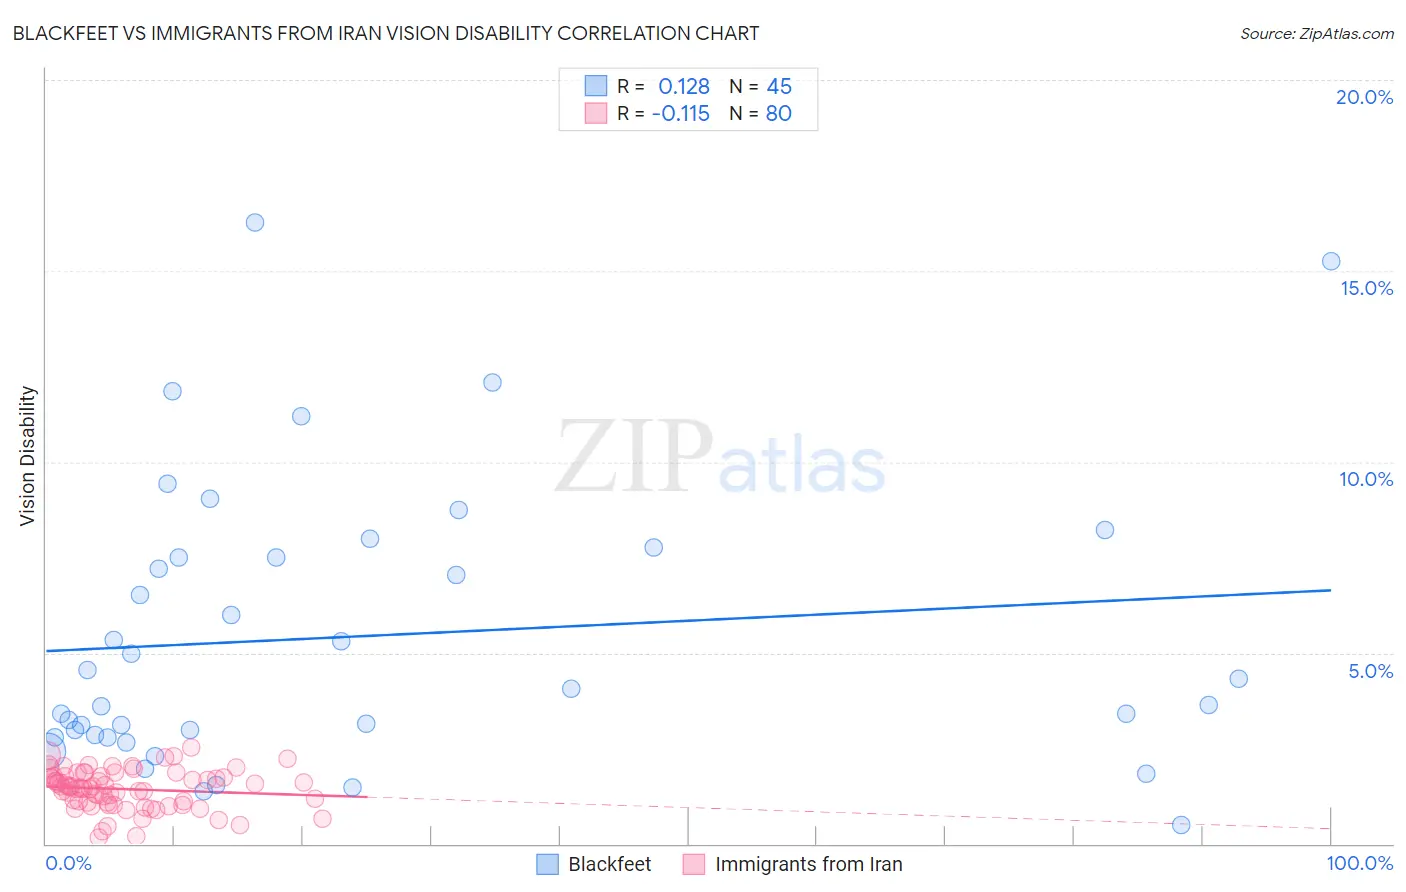
Blackfeet vs Immigrants from Iran Vision Disability Correlation Chart
The statistical analysis conducted on geographies consisting of 309,368,120 people shows a poor positive correlation between the proportion of Blackfeet and percentage of population with vision disability in the United States with a correlation coefficient (R) of 0.128 and weighted average of 2.6%. Similarly, the statistical analysis conducted on geographies consisting of 279,802,933 people shows a poor negative correlation between the proportion of Immigrants from Iran and percentage of population with vision disability in the United States with a correlation coefficient (R) of -0.115 and weighted average of 1.8%, a difference of 47.1%.
Vision Disability Correlation Summary
| Measurement | Blackfeet | Immigrants from Iran |
| Minimum | 0.51% | 0.16% |
| Maximum | 16.3% | 2.5% |
| Range | 15.8% | 2.4% |
| Mean | 5.4% | 1.4% |
| Median | 4.1% | 1.5% |
| Interquartile 25% (IQ1) | 2.8% | 1.1% |
| Interquartile 75% (IQ3) | 7.6% | 1.8% |
| Interquartile Range (IQR) | 4.8% | 0.67% |
| Standard Deviation (Sample) | 3.7% | 0.50% |
| Standard Deviation (Population) | 3.7% | 0.50% |
Similar Demographics by Vision Disability
Demographics Similar to Blackfeet by Vision Disability
In terms of vision disability, the demographic groups most similar to Blackfeet are Dominican (2.6%, a difference of 0.040%), Immigrants from Yemen (2.6%, a difference of 0.32%), Arapaho (2.6%, a difference of 0.61%), Immigrants from Dominican Republic (2.6%, a difference of 0.63%), and Iroquois (2.6%, a difference of 0.65%).
| Demographics | Rating | Rank | Vision Disability |
| Immigrants | Cabo Verde | 0.0 /100 | #303 | Tragic 2.6% |
| Aleuts | 0.0 /100 | #304 | Tragic 2.6% |
| Hispanics or Latinos | 0.0 /100 | #305 | Tragic 2.6% |
| Iroquois | 0.0 /100 | #306 | Tragic 2.6% |
| Immigrants | Dominican Republic | 0.0 /100 | #307 | Tragic 2.6% |
| Arapaho | 0.0 /100 | #308 | Tragic 2.6% |
| Immigrants | Yemen | 0.0 /100 | #309 | Tragic 2.6% |
| Blackfeet | 0.0 /100 | #310 | Tragic 2.6% |
| Dominicans | 0.0 /100 | #311 | Tragic 2.6% |
| Americans | 0.0 /100 | #312 | Tragic 2.6% |
| Potawatomi | 0.0 /100 | #313 | Tragic 2.6% |
| Inupiat | 0.0 /100 | #314 | Tragic 2.7% |
| Osage | 0.0 /100 | #315 | Tragic 2.7% |
| Shoshone | 0.0 /100 | #316 | Tragic 2.7% |
| Yup'ik | 0.0 /100 | #317 | Tragic 2.7% |
Demographics Similar to Immigrants from Iran by Vision Disability
In terms of vision disability, the demographic groups most similar to Immigrants from Iran are Immigrants from South Central Asia (1.8%, a difference of 0.060%), Iranian (1.8%, a difference of 0.21%), Okinawan (1.8%, a difference of 0.59%), Immigrants from Singapore (1.8%, a difference of 0.95%), and Immigrants from Hong Kong (1.8%, a difference of 1.1%).
| Demographics | Rating | Rank | Vision Disability |
| Immigrants | India | 100.0 /100 | #1 | Exceptional 1.7% |
| Filipinos | 100.0 /100 | #2 | Exceptional 1.7% |
| Immigrants | Taiwan | 100.0 /100 | #3 | Exceptional 1.7% |
| Thais | 100.0 /100 | #4 | Exceptional 1.7% |
| Okinawans | 100.0 /100 | #5 | Exceptional 1.8% |
| Immigrants | Iran | 100.0 /100 | #6 | Exceptional 1.8% |
| Immigrants | South Central Asia | 100.0 /100 | #7 | Exceptional 1.8% |
| Iranians | 100.0 /100 | #8 | Exceptional 1.8% |
| Immigrants | Singapore | 100.0 /100 | #9 | Exceptional 1.8% |
| Immigrants | Hong Kong | 100.0 /100 | #10 | Exceptional 1.8% |
| Immigrants | Israel | 100.0 /100 | #11 | Exceptional 1.8% |
| Immigrants | Korea | 100.0 /100 | #12 | Exceptional 1.8% |
| Immigrants | Eastern Asia | 100.0 /100 | #13 | Exceptional 1.8% |
| Immigrants | China | 100.0 /100 | #14 | Exceptional 1.8% |
| Immigrants | Bolivia | 100.0 /100 | #15 | Exceptional 1.8% |