Bahamian vs Immigrants from Laos 3 or more Vehicles in Household
COMPARE
Bahamian
Immigrants from Laos
3 or more Vehicles in Household
3 or more Vehicles in Household Comparison
Bahamians
Immigrants from Laos
16.9%
3 OR MORE VEHICLES IN HOUSEHOLD
0.1/ 100
METRIC RATING
293rd/ 347
METRIC RANK
22.4%
3 OR MORE VEHICLES IN HOUSEHOLD
100.0/ 100
METRIC RATING
55th/ 347
METRIC RANK
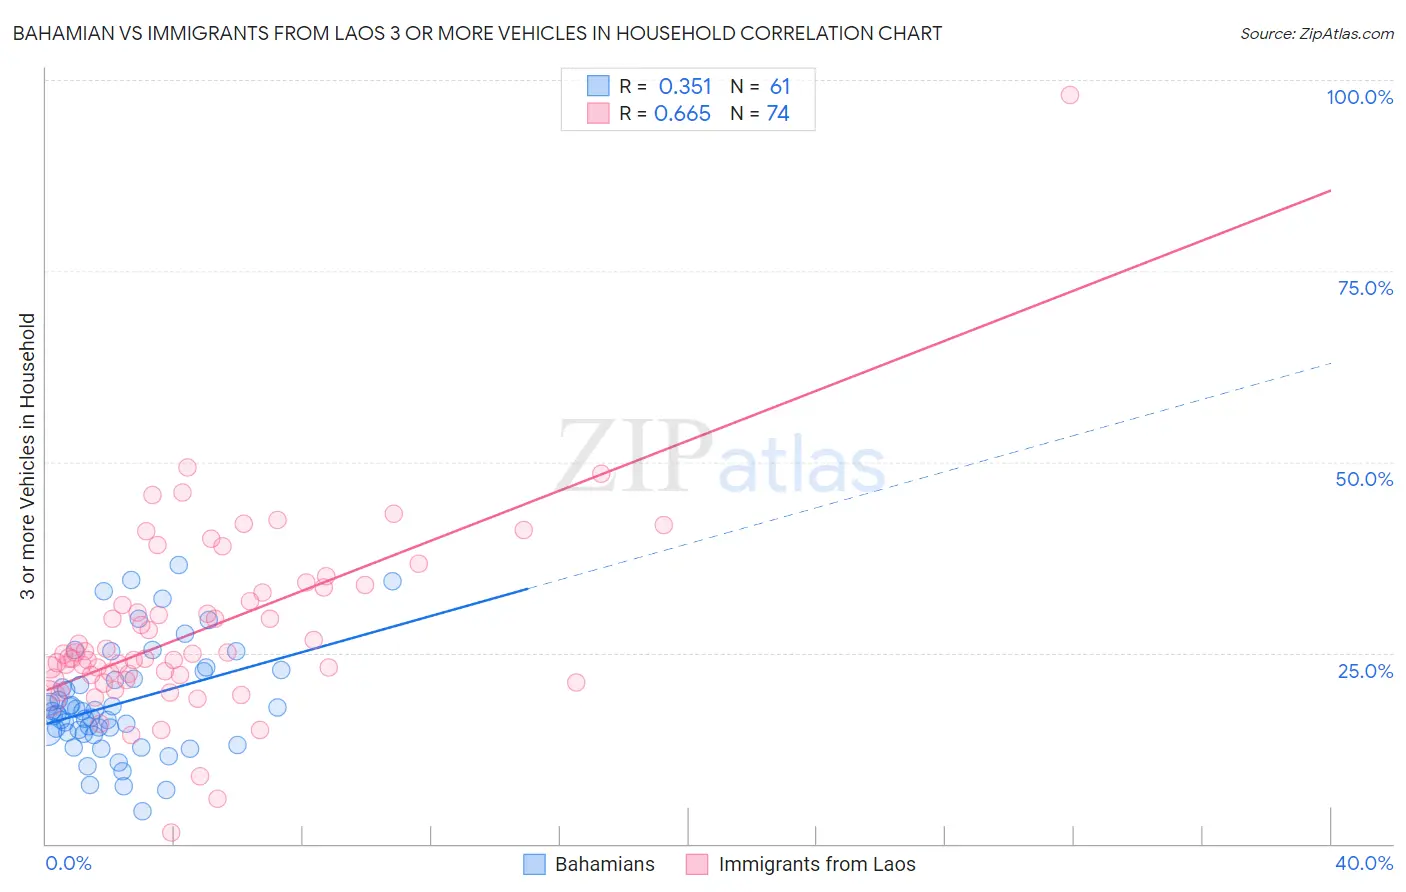
Bahamian vs Immigrants from Laos 3 or more Vehicles in Household Correlation Chart
The statistical analysis conducted on geographies consisting of 112,623,128 people shows a mild positive correlation between the proportion of Bahamians and percentage of households with 3 or more vehicles available in the United States with a correlation coefficient (R) of 0.351 and weighted average of 16.9%. Similarly, the statistical analysis conducted on geographies consisting of 201,457,324 people shows a significant positive correlation between the proportion of Immigrants from Laos and percentage of households with 3 or more vehicles available in the United States with a correlation coefficient (R) of 0.665 and weighted average of 22.4%, a difference of 32.1%.
3 or more Vehicles in Household Correlation Summary
| Measurement | Bahamian | Immigrants from Laos |
| Minimum | 4.2% | 1.5% |
| Maximum | 36.4% | 98.0% |
| Range | 32.2% | 96.4% |
| Mean | 18.4% | 28.1% |
| Median | 17.4% | 24.8% |
| Interquartile 25% (IQ1) | 14.5% | 22.0% |
| Interquartile 75% (IQ3) | 22.1% | 33.5% |
| Interquartile Range (IQR) | 7.5% | 11.5% |
| Standard Deviation (Sample) | 7.1% | 12.6% |
| Standard Deviation (Population) | 7.0% | 12.5% |
Similar Demographics by 3 or more Vehicles in Household
Demographics Similar to Bahamians by 3 or more Vehicles in Household
In terms of 3 or more vehicles in household, the demographic groups most similar to Bahamians are Immigrants from Spain (17.0%, a difference of 0.080%), Immigrants from Western Africa (16.9%, a difference of 0.11%), Immigrants from Russia (16.9%, a difference of 0.16%), Immigrants from Congo (17.0%, a difference of 0.20%), and Liberian (17.0%, a difference of 0.35%).
| Demographics | Rating | Rank | 3 or more Vehicles in Household |
| Menominee | 0.2 /100 | #286 | Tragic 17.2% |
| Immigrants | Brazil | 0.2 /100 | #287 | Tragic 17.1% |
| Immigrants | Uruguay | 0.2 /100 | #288 | Tragic 17.1% |
| Immigrants | Liberia | 0.1 /100 | #289 | Tragic 17.1% |
| Liberians | 0.1 /100 | #290 | Tragic 17.0% |
| Immigrants | Congo | 0.1 /100 | #291 | Tragic 17.0% |
| Immigrants | Spain | 0.1 /100 | #292 | Tragic 17.0% |
| Bahamians | 0.1 /100 | #293 | Tragic 16.9% |
| Immigrants | Western Africa | 0.1 /100 | #294 | Tragic 16.9% |
| Immigrants | Russia | 0.1 /100 | #295 | Tragic 16.9% |
| Inupiat | 0.1 /100 | #296 | Tragic 16.9% |
| Israelis | 0.1 /100 | #297 | Tragic 16.8% |
| Immigrants | Zaire | 0.1 /100 | #298 | Tragic 16.7% |
| Immigrants | South America | 0.1 /100 | #299 | Tragic 16.7% |
| Cypriots | 0.0 /100 | #300 | Tragic 16.6% |
Demographics Similar to Immigrants from Laos by 3 or more Vehicles in Household
In terms of 3 or more vehicles in household, the demographic groups most similar to Immigrants from Laos are Hispanic or Latino (22.4%, a difference of 0.030%), Pennsylvania German (22.3%, a difference of 0.18%), Spaniard (22.3%, a difference of 0.32%), Crow (22.5%, a difference of 0.37%), and Navajo (22.3%, a difference of 0.38%).
| Demographics | Rating | Rank | 3 or more Vehicles in Household |
| Scottish | 100.0 /100 | #48 | Exceptional 22.6% |
| Scotch-Irish | 100.0 /100 | #49 | Exceptional 22.6% |
| Sioux | 100.0 /100 | #50 | Exceptional 22.6% |
| Whites/Caucasians | 100.0 /100 | #51 | Exceptional 22.6% |
| Welsh | 100.0 /100 | #52 | Exceptional 22.6% |
| Czechs | 100.0 /100 | #53 | Exceptional 22.5% |
| Crow | 100.0 /100 | #54 | Exceptional 22.5% |
| Immigrants | Laos | 100.0 /100 | #55 | Exceptional 22.4% |
| Hispanics or Latinos | 100.0 /100 | #56 | Exceptional 22.4% |
| Pennsylvania Germans | 100.0 /100 | #57 | Exceptional 22.3% |
| Spaniards | 100.0 /100 | #58 | Exceptional 22.3% |
| Navajo | 100.0 /100 | #59 | Exceptional 22.3% |
| Finns | 99.9 /100 | #60 | Exceptional 22.3% |
| Bhutanese | 99.9 /100 | #61 | Exceptional 22.2% |
| Fijians | 99.9 /100 | #62 | Exceptional 22.2% |