Bahamian vs Immigrants from Czechoslovakia 2 or more Vehicles in Household
COMPARE
Bahamian
Immigrants from Czechoslovakia
2 or more Vehicles in Household
2 or more Vehicles in Household Comparison
Bahamians
Immigrants from Czechoslovakia
51.5%
2 OR MORE VEHICLES IN HOUSEHOLD
0.1/ 100
METRIC RATING
282nd/ 347
METRIC RANK
54.1%
2 OR MORE VEHICLES IN HOUSEHOLD
9.4/ 100
METRIC RATING
214th/ 347
METRIC RANK
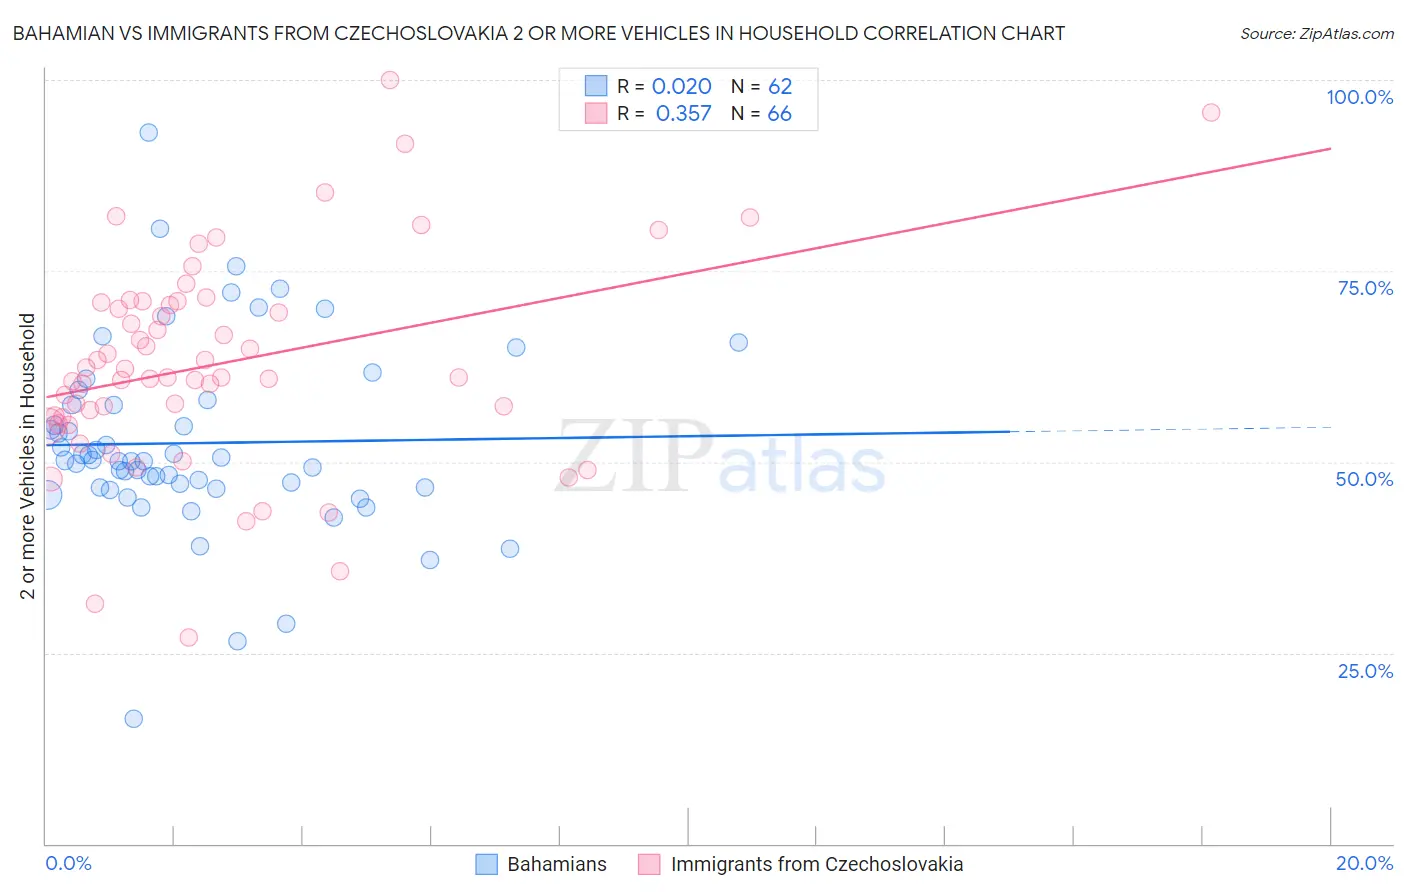
Bahamian vs Immigrants from Czechoslovakia 2 or more Vehicles in Household Correlation Chart
The statistical analysis conducted on geographies consisting of 112,649,221 people shows no correlation between the proportion of Bahamians and percentage of households with 2 or more vehicles available in the United States with a correlation coefficient (R) of 0.020 and weighted average of 51.5%. Similarly, the statistical analysis conducted on geographies consisting of 195,452,090 people shows a mild positive correlation between the proportion of Immigrants from Czechoslovakia and percentage of households with 2 or more vehicles available in the United States with a correlation coefficient (R) of 0.357 and weighted average of 54.1%, a difference of 5.0%.
2 or more Vehicles in Household Correlation Summary
| Measurement | Bahamian | Immigrants from Czechoslovakia |
| Minimum | 16.4% | 27.0% |
| Maximum | 93.2% | 100.0% |
| Range | 76.8% | 73.0% |
| Mean | 52.5% | 62.9% |
| Median | 50.1% | 61.1% |
| Interquartile 25% (IQ1) | 46.7% | 55.8% |
| Interquartile 75% (IQ3) | 57.5% | 70.9% |
| Interquartile Range (IQR) | 10.8% | 15.1% |
| Standard Deviation (Sample) | 12.5% | 13.9% |
| Standard Deviation (Population) | 12.4% | 13.8% |
Similar Demographics by 2 or more Vehicles in Household
Demographics Similar to Bahamians by 2 or more Vehicles in Household
In terms of 2 or more vehicles in household, the demographic groups most similar to Bahamians are Immigrants from Kazakhstan (51.6%, a difference of 0.060%), Immigrants from China (51.5%, a difference of 0.080%), Immigrants from Zaire (51.5%, a difference of 0.12%), Immigrants from Uruguay (51.4%, a difference of 0.28%), and Immigrants from Eastern Europe (51.7%, a difference of 0.37%).
| Demographics | Rating | Rank | 2 or more Vehicles in Household |
| Immigrants | Honduras | 0.2 /100 | #275 | Tragic 51.8% |
| Immigrants | Croatia | 0.2 /100 | #276 | Tragic 51.8% |
| Immigrants | Africa | 0.2 /100 | #277 | Tragic 51.8% |
| Yuman | 0.1 /100 | #278 | Tragic 51.7% |
| Liberians | 0.1 /100 | #279 | Tragic 51.7% |
| Immigrants | Eastern Europe | 0.1 /100 | #280 | Tragic 51.7% |
| Immigrants | Kazakhstan | 0.1 /100 | #281 | Tragic 51.6% |
| Bahamians | 0.1 /100 | #282 | Tragic 51.5% |
| Immigrants | China | 0.1 /100 | #283 | Tragic 51.5% |
| Immigrants | Zaire | 0.1 /100 | #284 | Tragic 51.5% |
| Immigrants | Uruguay | 0.1 /100 | #285 | Tragic 51.4% |
| Immigrants | Liberia | 0.1 /100 | #286 | Tragic 51.3% |
| Immigrants | Serbia | 0.1 /100 | #287 | Tragic 51.3% |
| Okinawans | 0.1 /100 | #288 | Tragic 51.2% |
| Somalis | 0.0 /100 | #289 | Tragic 51.1% |
Demographics Similar to Immigrants from Czechoslovakia by 2 or more Vehicles in Household
In terms of 2 or more vehicles in household, the demographic groups most similar to Immigrants from Czechoslovakia are Aleut (54.1%, a difference of 0.010%), Guatemalan (54.1%, a difference of 0.020%), Immigrants from Western Asia (54.1%, a difference of 0.020%), Immigrants from Chile (54.2%, a difference of 0.18%), and Immigrants from Saudi Arabia (54.2%, a difference of 0.21%).
| Demographics | Rating | Rank | 2 or more Vehicles in Household |
| Turks | 13.0 /100 | #207 | Poor 54.3% |
| Egyptians | 12.0 /100 | #208 | Poor 54.3% |
| Immigrants | Bulgaria | 12.0 /100 | #209 | Poor 54.3% |
| Immigrants | Saudi Arabia | 11.3 /100 | #210 | Poor 54.2% |
| Immigrants | Hungary | 11.3 /100 | #211 | Poor 54.2% |
| Immigrants | Chile | 11.1 /100 | #212 | Poor 54.2% |
| Guatemalans | 9.6 /100 | #213 | Tragic 54.1% |
| Immigrants | Czechoslovakia | 9.4 /100 | #214 | Tragic 54.1% |
| Aleuts | 9.3 /100 | #215 | Tragic 54.1% |
| Immigrants | Western Asia | 9.3 /100 | #216 | Tragic 54.1% |
| Immigrants | Burma/Myanmar | 7.1 /100 | #217 | Tragic 53.9% |
| Immigrants | Argentina | 6.8 /100 | #218 | Tragic 53.9% |
| South American Indians | 6.5 /100 | #219 | Tragic 53.9% |
| Taiwanese | 6.3 /100 | #220 | Tragic 53.9% |
| Immigrants | Singapore | 6.3 /100 | #221 | Tragic 53.9% |