Bahamian vs Immigrants from Czechoslovakia Master's Degree
COMPARE
Bahamian
Immigrants from Czechoslovakia
Master's Degree
Master's Degree Comparison
Bahamians
Immigrants from Czechoslovakia
12.4%
MASTER'S DEGREE
0.5/ 100
METRIC RATING
266th/ 347
METRIC RANK
18.5%
MASTER'S DEGREE
99.9/ 100
METRIC RATING
53rd/ 347
METRIC RANK
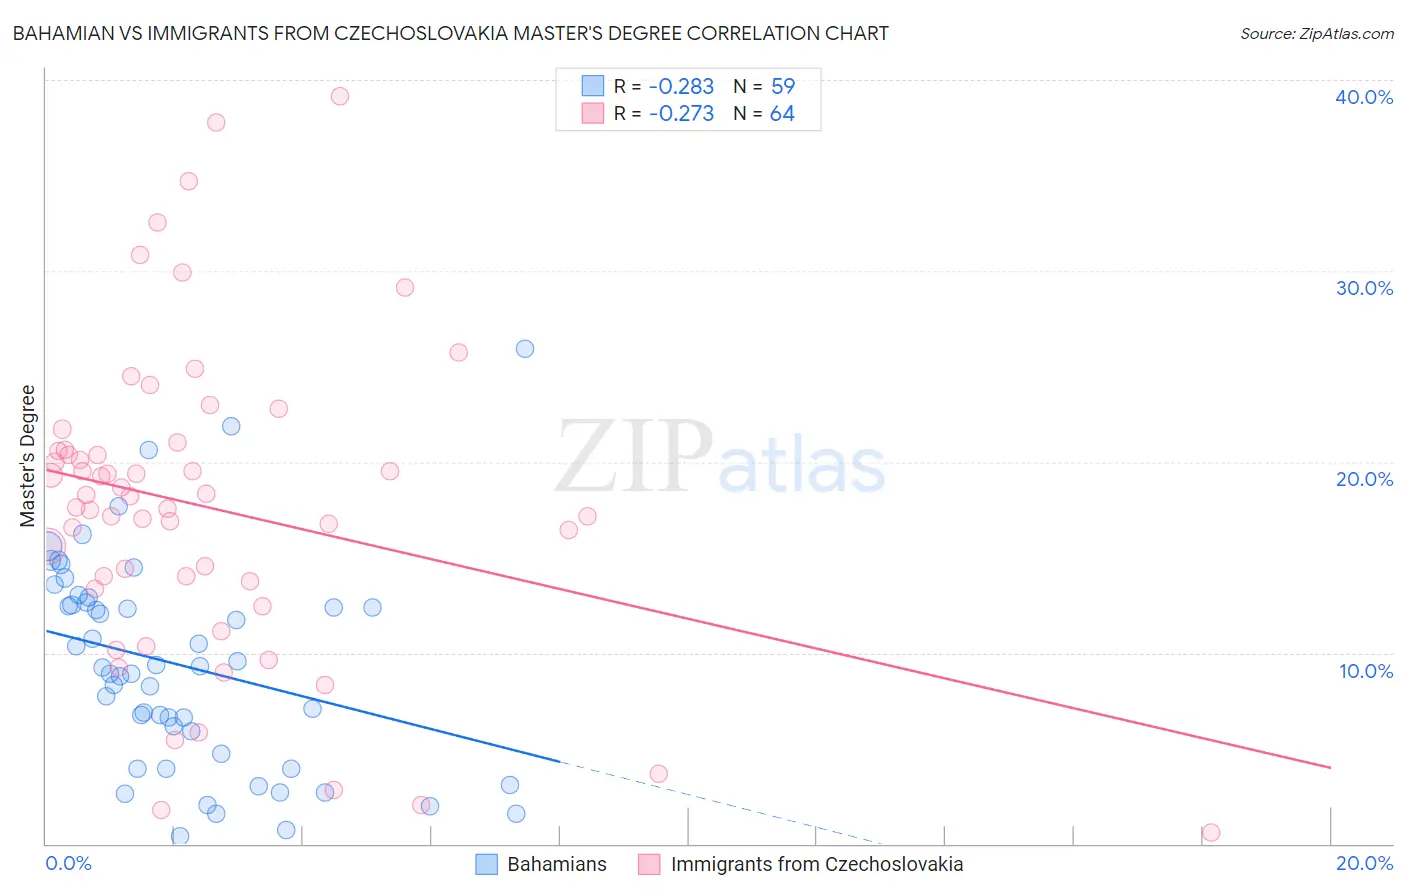
Bahamian vs Immigrants from Czechoslovakia Master's Degree Correlation Chart
The statistical analysis conducted on geographies consisting of 112,667,548 people shows a weak negative correlation between the proportion of Bahamians and percentage of population with at least master's degree education in the United States with a correlation coefficient (R) of -0.283 and weighted average of 12.4%. Similarly, the statistical analysis conducted on geographies consisting of 195,445,199 people shows a weak negative correlation between the proportion of Immigrants from Czechoslovakia and percentage of population with at least master's degree education in the United States with a correlation coefficient (R) of -0.273 and weighted average of 18.5%, a difference of 49.6%.
Master's Degree Correlation Summary
| Measurement | Bahamian | Immigrants from Czechoslovakia |
| Minimum | 0.39% | 0.60% |
| Maximum | 25.9% | 39.2% |
| Range | 25.5% | 38.6% |
| Mean | 9.4% | 17.6% |
| Median | 9.3% | 17.9% |
| Interquartile 25% (IQ1) | 4.7% | 13.6% |
| Interquartile 75% (IQ3) | 12.6% | 20.6% |
| Interquartile Range (IQR) | 7.9% | 7.0% |
| Standard Deviation (Sample) | 5.5% | 8.2% |
| Standard Deviation (Population) | 5.4% | 8.1% |
Similar Demographics by Master's Degree
Demographics Similar to Bahamians by Master's Degree
In terms of master's degree, the demographic groups most similar to Bahamians are Immigrants from Fiji (12.4%, a difference of 0.16%), Belizean (12.4%, a difference of 0.18%), Central American Indian (12.4%, a difference of 0.34%), Nicaraguan (12.5%, a difference of 0.58%), and Tongan (12.5%, a difference of 0.76%).
| Demographics | Rating | Rank | Master's Degree |
| Japanese | 0.6 /100 | #259 | Tragic 12.5% |
| Dominicans | 0.6 /100 | #260 | Tragic 12.5% |
| Tongans | 0.6 /100 | #261 | Tragic 12.5% |
| Nicaraguans | 0.6 /100 | #262 | Tragic 12.5% |
| Central American Indians | 0.5 /100 | #263 | Tragic 12.4% |
| Belizeans | 0.5 /100 | #264 | Tragic 12.4% |
| Immigrants | Fiji | 0.5 /100 | #265 | Tragic 12.4% |
| Bahamians | 0.5 /100 | #266 | Tragic 12.4% |
| Americans | 0.4 /100 | #267 | Tragic 12.3% |
| Native Hawaiians | 0.4 /100 | #268 | Tragic 12.3% |
| Central Americans | 0.3 /100 | #269 | Tragic 12.2% |
| Salvadorans | 0.3 /100 | #270 | Tragic 12.2% |
| Haitians | 0.3 /100 | #271 | Tragic 12.1% |
| Comanche | 0.3 /100 | #272 | Tragic 12.1% |
| Blackfeet | 0.3 /100 | #273 | Tragic 12.1% |
Demographics Similar to Immigrants from Czechoslovakia by Master's Degree
In terms of master's degree, the demographic groups most similar to Immigrants from Czechoslovakia are Immigrants from Kuwait (18.6%, a difference of 0.080%), Immigrants from Lithuania (18.5%, a difference of 0.31%), Immigrants from Serbia (18.5%, a difference of 0.34%), Asian (18.4%, a difference of 0.57%), and Immigrants from Asia (18.4%, a difference of 0.70%).
| Demographics | Rating | Rank | Master's Degree |
| Immigrants | Norway | 100.0 /100 | #46 | Exceptional 18.8% |
| Immigrants | Austria | 100.0 /100 | #47 | Exceptional 18.8% |
| Paraguayans | 100.0 /100 | #48 | Exceptional 18.8% |
| Estonians | 100.0 /100 | #49 | Exceptional 18.8% |
| Bulgarians | 100.0 /100 | #50 | Exceptional 18.8% |
| Immigrants | South Africa | 100.0 /100 | #51 | Exceptional 18.8% |
| Immigrants | Kuwait | 100.0 /100 | #52 | Exceptional 18.6% |
| Immigrants | Czechoslovakia | 99.9 /100 | #53 | Exceptional 18.5% |
| Immigrants | Lithuania | 99.9 /100 | #54 | Exceptional 18.5% |
| Immigrants | Serbia | 99.9 /100 | #55 | Exceptional 18.5% |
| Asians | 99.9 /100 | #56 | Exceptional 18.4% |
| Immigrants | Asia | 99.9 /100 | #57 | Exceptional 18.4% |
| Australians | 99.9 /100 | #58 | Exceptional 18.4% |
| Immigrants | Bulgaria | 99.9 /100 | #59 | Exceptional 18.3% |
| New Zealanders | 99.9 /100 | #60 | Exceptional 18.3% |