Belgian vs Immigrants from Czechoslovakia 2 or more Vehicles in Household
COMPARE
Belgian
Immigrants from Czechoslovakia
2 or more Vehicles in Household
2 or more Vehicles in Household Comparison
Belgians
Immigrants from Czechoslovakia
59.3%
2 OR MORE VEHICLES IN HOUSEHOLD
99.9/ 100
METRIC RATING
49th/ 347
METRIC RANK
54.1%
2 OR MORE VEHICLES IN HOUSEHOLD
9.4/ 100
METRIC RATING
214th/ 347
METRIC RANK
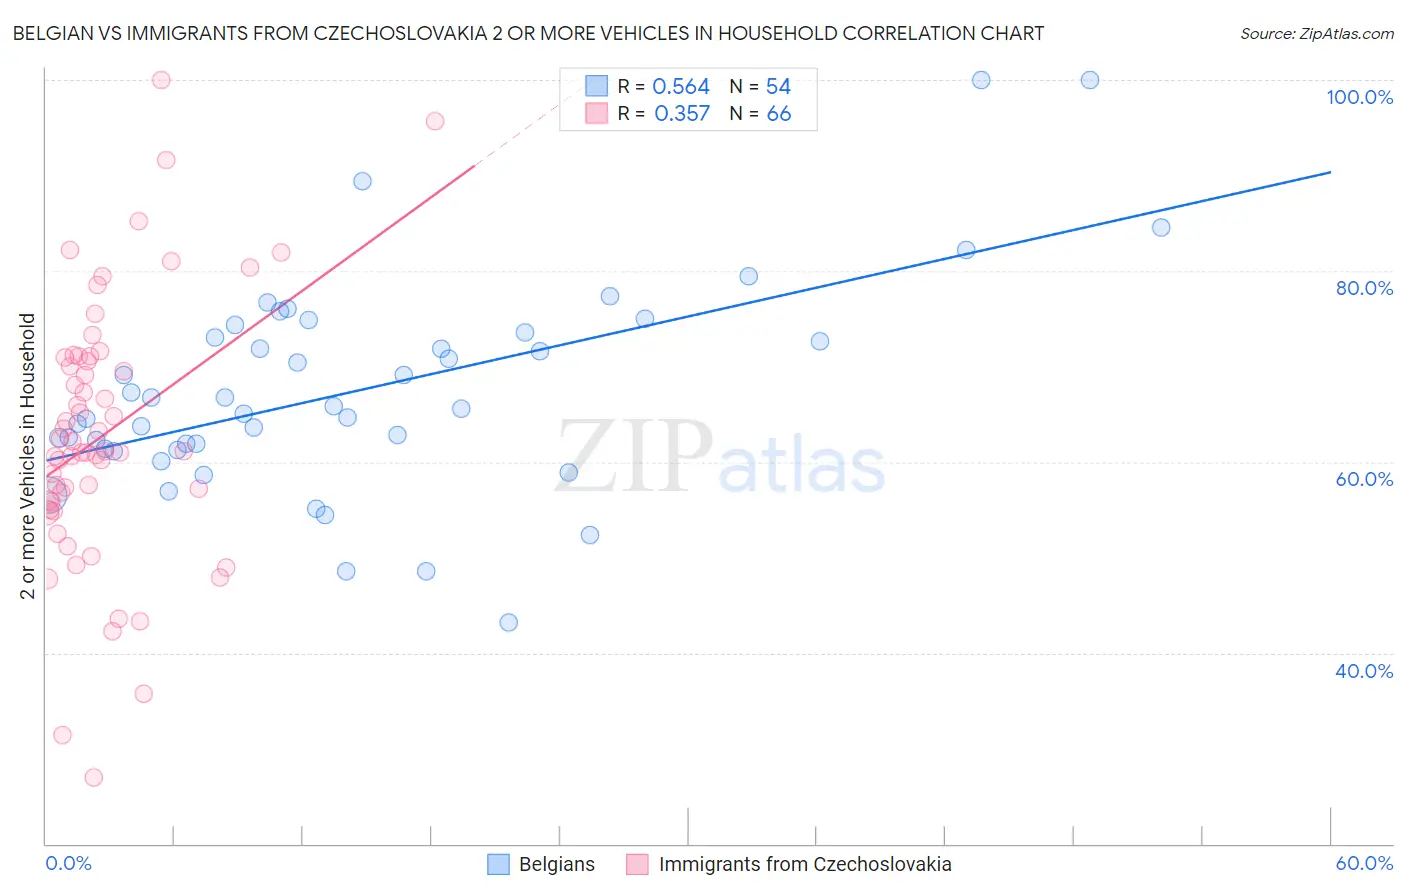
Belgian vs Immigrants from Czechoslovakia 2 or more Vehicles in Household Correlation Chart
The statistical analysis conducted on geographies consisting of 355,869,079 people shows a substantial positive correlation between the proportion of Belgians and percentage of households with 2 or more vehicles available in the United States with a correlation coefficient (R) of 0.564 and weighted average of 59.3%. Similarly, the statistical analysis conducted on geographies consisting of 195,452,090 people shows a mild positive correlation between the proportion of Immigrants from Czechoslovakia and percentage of households with 2 or more vehicles available in the United States with a correlation coefficient (R) of 0.357 and weighted average of 54.1%, a difference of 9.5%.
2 or more Vehicles in Household Correlation Summary
| Measurement | Belgian | Immigrants from Czechoslovakia |
| Minimum | 43.1% | 27.0% |
| Maximum | 100.0% | 100.0% |
| Range | 56.9% | 73.0% |
| Mean | 67.6% | 62.9% |
| Median | 65.7% | 61.1% |
| Interquartile 25% (IQ1) | 61.3% | 55.8% |
| Interquartile 75% (IQ3) | 73.6% | 70.9% |
| Interquartile Range (IQR) | 12.3% | 15.1% |
| Standard Deviation (Sample) | 11.1% | 13.9% |
| Standard Deviation (Population) | 11.0% | 13.8% |
Similar Demographics by 2 or more Vehicles in Household
Demographics Similar to Belgians by 2 or more Vehicles in Household
In terms of 2 or more vehicles in household, the demographic groups most similar to Belgians are Choctaw (59.3%, a difference of 0.010%), Immigrants from India (59.3%, a difference of 0.040%), Yaqui (59.3%, a difference of 0.060%), Spaniard (59.2%, a difference of 0.15%), and Immigrants from Laos (59.2%, a difference of 0.15%).
| Demographics | Rating | Rank | 2 or more Vehicles in Household |
| Malaysians | 100.0 /100 | #42 | Exceptional 59.8% |
| Czechoslovakians | 100.0 /100 | #43 | Exceptional 59.8% |
| French | 100.0 /100 | #44 | Exceptional 59.8% |
| Immigrants | Taiwan | 100.0 /100 | #45 | Exceptional 59.7% |
| Immigrants | South Eastern Asia | 100.0 /100 | #46 | Exceptional 59.6% |
| Yaqui | 99.9 /100 | #47 | Exceptional 59.3% |
| Immigrants | India | 99.9 /100 | #48 | Exceptional 59.3% |
| Belgians | 99.9 /100 | #49 | Exceptional 59.3% |
| Choctaw | 99.9 /100 | #50 | Exceptional 59.3% |
| Spaniards | 99.9 /100 | #51 | Exceptional 59.2% |
| Immigrants | Laos | 99.9 /100 | #52 | Exceptional 59.2% |
| Celtics | 99.9 /100 | #53 | Exceptional 59.2% |
| Bhutanese | 99.9 /100 | #54 | Exceptional 59.1% |
| Luxembourgers | 99.9 /100 | #55 | Exceptional 59.1% |
| Chickasaw | 99.9 /100 | #56 | Exceptional 59.0% |
Demographics Similar to Immigrants from Czechoslovakia by 2 or more Vehicles in Household
In terms of 2 or more vehicles in household, the demographic groups most similar to Immigrants from Czechoslovakia are Aleut (54.1%, a difference of 0.010%), Guatemalan (54.1%, a difference of 0.020%), Immigrants from Western Asia (54.1%, a difference of 0.020%), Immigrants from Chile (54.2%, a difference of 0.18%), and Immigrants from Saudi Arabia (54.2%, a difference of 0.21%).
| Demographics | Rating | Rank | 2 or more Vehicles in Household |
| Turks | 13.0 /100 | #207 | Poor 54.3% |
| Egyptians | 12.0 /100 | #208 | Poor 54.3% |
| Immigrants | Bulgaria | 12.0 /100 | #209 | Poor 54.3% |
| Immigrants | Saudi Arabia | 11.3 /100 | #210 | Poor 54.2% |
| Immigrants | Hungary | 11.3 /100 | #211 | Poor 54.2% |
| Immigrants | Chile | 11.1 /100 | #212 | Poor 54.2% |
| Guatemalans | 9.6 /100 | #213 | Tragic 54.1% |
| Immigrants | Czechoslovakia | 9.4 /100 | #214 | Tragic 54.1% |
| Aleuts | 9.3 /100 | #215 | Tragic 54.1% |
| Immigrants | Western Asia | 9.3 /100 | #216 | Tragic 54.1% |
| Immigrants | Burma/Myanmar | 7.1 /100 | #217 | Tragic 53.9% |
| Immigrants | Argentina | 6.8 /100 | #218 | Tragic 53.9% |
| South American Indians | 6.5 /100 | #219 | Tragic 53.9% |
| Taiwanese | 6.3 /100 | #220 | Tragic 53.9% |
| Immigrants | Singapore | 6.3 /100 | #221 | Tragic 53.9% |