Bahamian vs Immigrants from Czechoslovakia Unemployment Among Ages 30 to 34 years
COMPARE
Bahamian
Immigrants from Czechoslovakia
Unemployment Among Ages 30 to 34 years
Unemployment Among Ages 30 to 34 years Comparison
Bahamians
Immigrants from Czechoslovakia
6.6%
UNEMPLOYMENT AMONG AGES 30 TO 34 YEARS
0.0/ 100
METRIC RATING
300th/ 347
METRIC RANK
5.3%
UNEMPLOYMENT AMONG AGES 30 TO 34 YEARS
89.5/ 100
METRIC RATING
100th/ 347
METRIC RANK
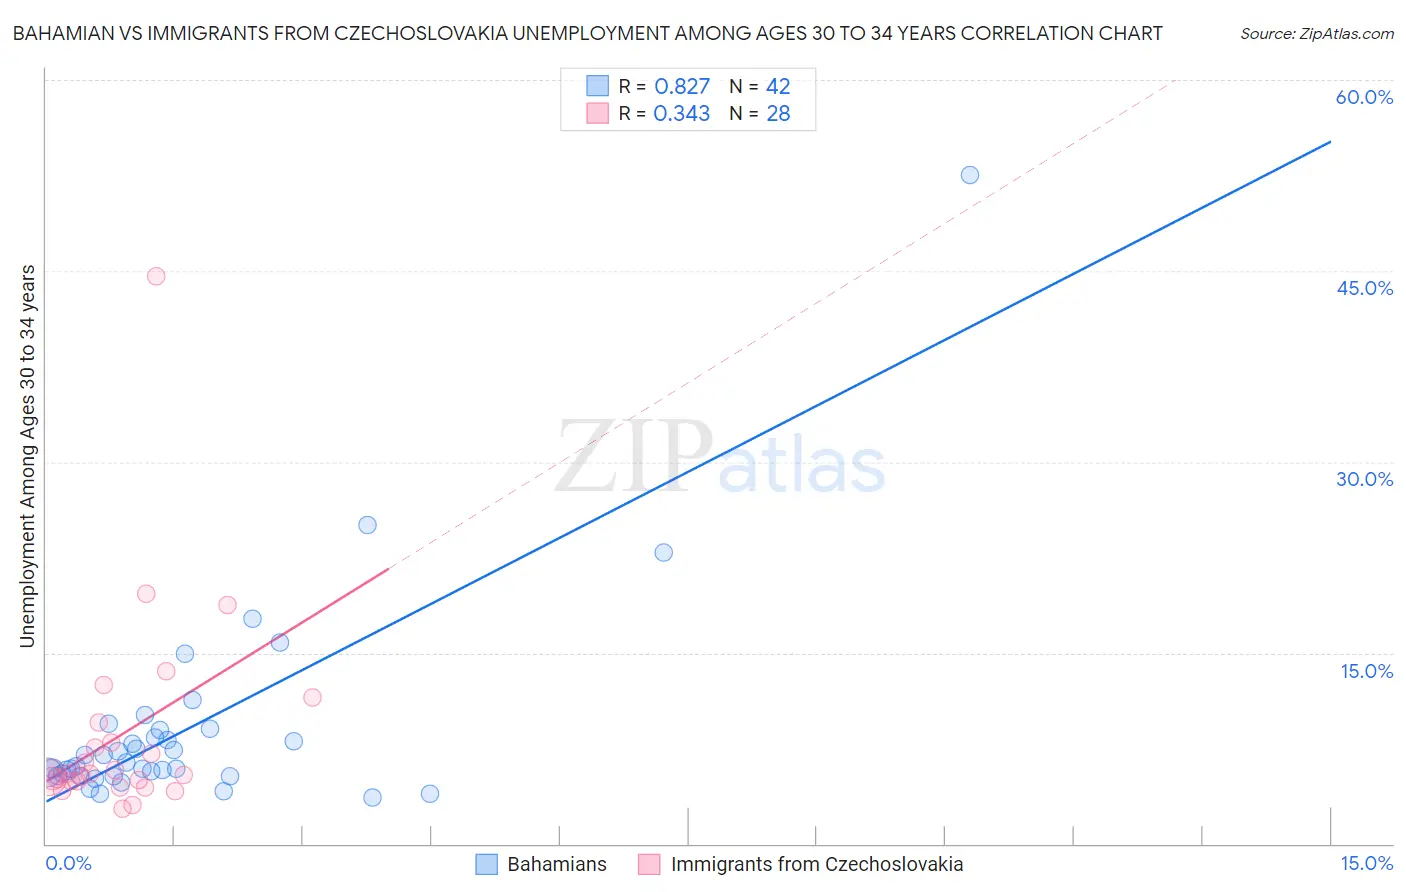
Bahamian vs Immigrants from Czechoslovakia Unemployment Among Ages 30 to 34 years Correlation Chart
The statistical analysis conducted on geographies consisting of 110,229,409 people shows a very strong positive correlation between the proportion of Bahamians and unemployment rate among population between the ages 30 and 34 in the United States with a correlation coefficient (R) of 0.827 and weighted average of 6.6%. Similarly, the statistical analysis conducted on geographies consisting of 189,322,017 people shows a mild positive correlation between the proportion of Immigrants from Czechoslovakia and unemployment rate among population between the ages 30 and 34 in the United States with a correlation coefficient (R) of 0.343 and weighted average of 5.3%, a difference of 25.2%.
Unemployment Among Ages 30 to 34 years Correlation Summary
| Measurement | Bahamian | Immigrants from Czechoslovakia |
| Minimum | 3.6% | 2.7% |
| Maximum | 52.5% | 44.6% |
| Range | 48.9% | 41.9% |
| Mean | 9.1% | 8.6% |
| Median | 6.3% | 5.4% |
| Interquartile 25% (IQ1) | 5.3% | 4.9% |
| Interquartile 75% (IQ3) | 8.9% | 8.7% |
| Interquartile Range (IQR) | 3.6% | 3.8% |
| Standard Deviation (Sample) | 8.3% | 8.3% |
| Standard Deviation (Population) | 8.2% | 8.1% |
Similar Demographics by Unemployment Among Ages 30 to 34 years
Demographics Similar to Bahamians by Unemployment Among Ages 30 to 34 years
In terms of unemployment among ages 30 to 34 years, the demographic groups most similar to Bahamians are Dutch West Indian (6.6%, a difference of 0.050%), Immigrants from Barbados (6.6%, a difference of 0.15%), Belizean (6.6%, a difference of 0.29%), Creek (6.6%, a difference of 0.40%), and Immigrants from Jamaica (6.5%, a difference of 0.50%).
| Demographics | Rating | Rank | Unemployment Among Ages 30 to 34 years |
| West Indians | 0.0 /100 | #293 | Tragic 6.5% |
| Barbadians | 0.0 /100 | #294 | Tragic 6.5% |
| Trinidadians and Tobagonians | 0.0 /100 | #295 | Tragic 6.5% |
| Immigrants | Jamaica | 0.0 /100 | #296 | Tragic 6.5% |
| Creek | 0.0 /100 | #297 | Tragic 6.6% |
| Immigrants | Barbados | 0.0 /100 | #298 | Tragic 6.6% |
| Dutch West Indians | 0.0 /100 | #299 | Tragic 6.6% |
| Bahamians | 0.0 /100 | #300 | Tragic 6.6% |
| Belizeans | 0.0 /100 | #301 | Tragic 6.6% |
| Delaware | 0.0 /100 | #302 | Tragic 6.7% |
| Cajuns | 0.0 /100 | #303 | Tragic 6.7% |
| Kiowa | 0.0 /100 | #304 | Tragic 6.7% |
| Paiute | 0.0 /100 | #305 | Tragic 6.7% |
| Immigrants | Armenia | 0.0 /100 | #306 | Tragic 6.8% |
| Immigrants | Belize | 0.0 /100 | #307 | Tragic 6.9% |
Demographics Similar to Immigrants from Czechoslovakia by Unemployment Among Ages 30 to 34 years
In terms of unemployment among ages 30 to 34 years, the demographic groups most similar to Immigrants from Czechoslovakia are British (5.3%, a difference of 0.080%), Immigrants from Switzerland (5.3%, a difference of 0.13%), Immigrants from Jordan (5.3%, a difference of 0.14%), Immigrants from Ireland (5.2%, a difference of 0.21%), and Immigrants from North Macedonia (5.2%, a difference of 0.27%).
| Demographics | Rating | Rank | Unemployment Among Ages 30 to 34 years |
| Laotians | 92.4 /100 | #93 | Exceptional 5.2% |
| Maltese | 92.3 /100 | #94 | Exceptional 5.2% |
| Kenyans | 92.1 /100 | #95 | Exceptional 5.2% |
| Mongolians | 91.7 /100 | #96 | Exceptional 5.2% |
| Europeans | 91.7 /100 | #97 | Exceptional 5.2% |
| Immigrants | North Macedonia | 90.9 /100 | #98 | Exceptional 5.2% |
| Immigrants | Ireland | 90.6 /100 | #99 | Exceptional 5.2% |
| Immigrants | Czechoslovakia | 89.5 /100 | #100 | Excellent 5.3% |
| British | 89.1 /100 | #101 | Excellent 5.3% |
| Immigrants | Switzerland | 88.8 /100 | #102 | Excellent 5.3% |
| Immigrants | Jordan | 88.8 /100 | #103 | Excellent 5.3% |
| Northern Europeans | 87.9 /100 | #104 | Excellent 5.3% |
| Argentineans | 87.9 /100 | #105 | Excellent 5.3% |
| Croatians | 87.6 /100 | #106 | Excellent 5.3% |
| Icelanders | 87.2 /100 | #107 | Excellent 5.3% |