Bahamian vs Immigrants from Czechoslovakia Unemployment Among Seniors over 75 years
COMPARE
Bahamian
Immigrants from Czechoslovakia
Unemployment Among Seniors over 75 years
Unemployment Among Seniors over 75 years Comparison
Bahamians
Immigrants from Czechoslovakia
7.8%
UNEMPLOYMENT AMONG SENIORS OVER 75 YEARS
100.0/ 100
METRIC RATING
52nd/ 347
METRIC RANK
8.4%
UNEMPLOYMENT AMONG SENIORS OVER 75 YEARS
93.4/ 100
METRIC RATING
134th/ 347
METRIC RANK
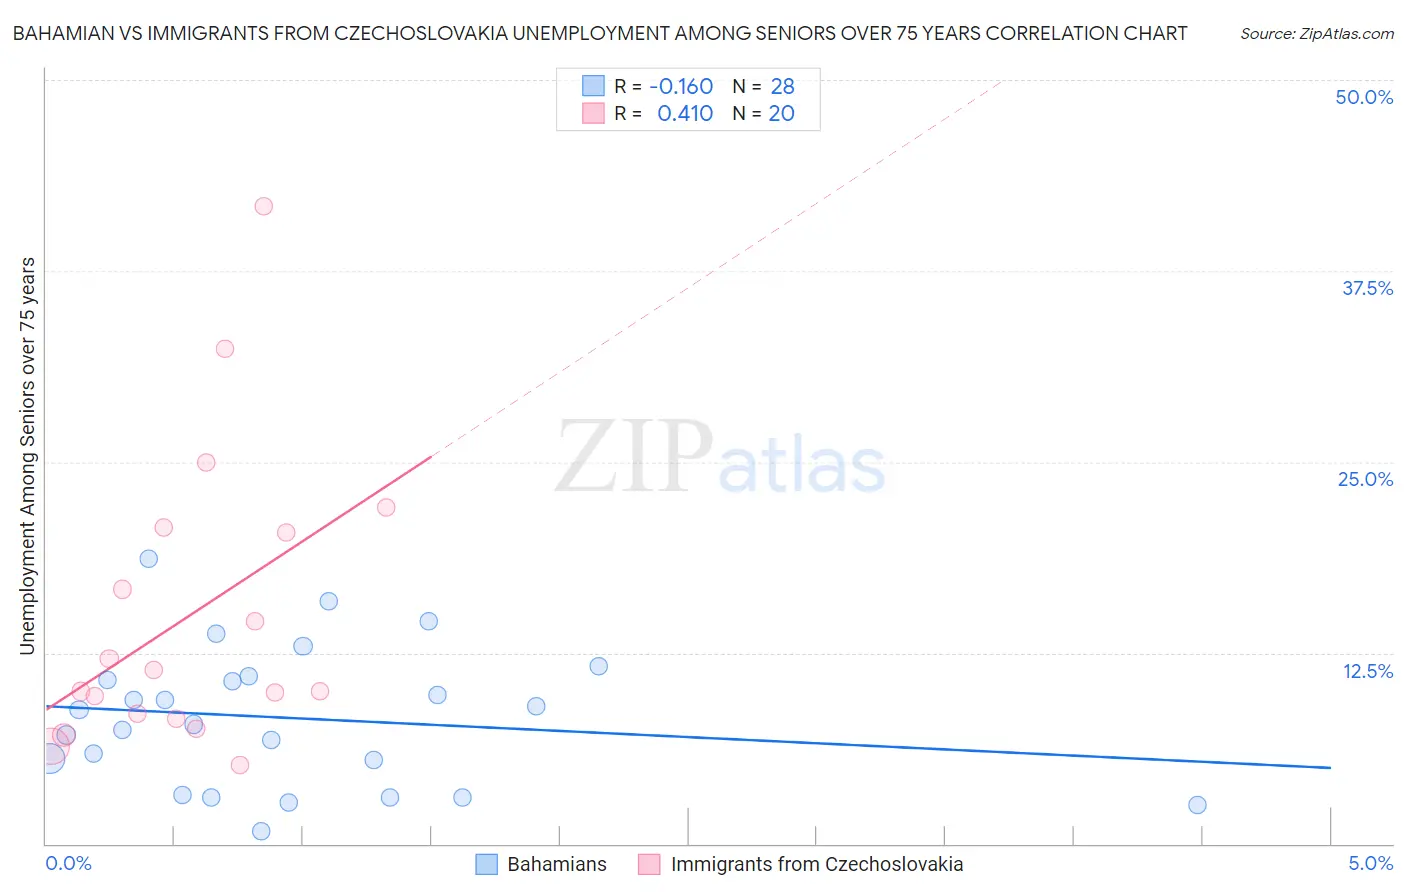
Bahamian vs Immigrants from Czechoslovakia Unemployment Among Seniors over 75 years Correlation Chart
The statistical analysis conducted on geographies consisting of 79,279,654 people shows a poor negative correlation between the proportion of Bahamians and unemployment rate among seniors over the age of 75 in the United States with a correlation coefficient (R) of -0.160 and weighted average of 7.8%. Similarly, the statistical analysis conducted on geographies consisting of 126,790,513 people shows a moderate positive correlation between the proportion of Immigrants from Czechoslovakia and unemployment rate among seniors over the age of 75 in the United States with a correlation coefficient (R) of 0.410 and weighted average of 8.4%, a difference of 7.5%.
Unemployment Among Seniors over 75 years Correlation Summary
| Measurement | Bahamian | Immigrants from Czechoslovakia |
| Minimum | 0.80% | 5.2% |
| Maximum | 18.6% | 41.7% |
| Range | 17.8% | 36.6% |
| Mean | 8.2% | 15.0% |
| Median | 8.3% | 10.7% |
| Interquartile 25% (IQ1) | 4.3% | 8.4% |
| Interquartile 75% (IQ3) | 10.8% | 20.5% |
| Interquartile Range (IQR) | 6.5% | 12.2% |
| Standard Deviation (Sample) | 4.5% | 9.6% |
| Standard Deviation (Population) | 4.4% | 9.3% |
Similar Demographics by Unemployment Among Seniors over 75 years
Demographics Similar to Bahamians by Unemployment Among Seniors over 75 years
In terms of unemployment among seniors over 75 years, the demographic groups most similar to Bahamians are Immigrants from Egypt (7.9%, a difference of 0.070%), Immigrants from Malaysia (7.9%, a difference of 0.10%), Moroccan (7.8%, a difference of 0.24%), Immigrants from Latvia (7.8%, a difference of 0.30%), and Potawatomi (7.8%, a difference of 0.32%).
| Demographics | Rating | Rank | Unemployment Among Seniors over 75 years |
| British West Indians | 100.0 /100 | #45 | Exceptional 7.8% |
| Immigrants | China | 100.0 /100 | #46 | Exceptional 7.8% |
| Creek | 100.0 /100 | #47 | Exceptional 7.8% |
| Immigrants | Chile | 100.0 /100 | #48 | Exceptional 7.8% |
| Potawatomi | 100.0 /100 | #49 | Exceptional 7.8% |
| Immigrants | Latvia | 100.0 /100 | #50 | Exceptional 7.8% |
| Moroccans | 100.0 /100 | #51 | Exceptional 7.8% |
| Bahamians | 100.0 /100 | #52 | Exceptional 7.8% |
| Immigrants | Egypt | 100.0 /100 | #53 | Exceptional 7.9% |
| Immigrants | Malaysia | 99.9 /100 | #54 | Exceptional 7.9% |
| Filipinos | 99.9 /100 | #55 | Exceptional 7.9% |
| Immigrants | Eastern Asia | 99.9 /100 | #56 | Exceptional 7.9% |
| Ottawa | 99.9 /100 | #57 | Exceptional 7.9% |
| Iranians | 99.9 /100 | #58 | Exceptional 7.9% |
| Indonesians | 99.9 /100 | #59 | Exceptional 7.9% |
Demographics Similar to Immigrants from Czechoslovakia by Unemployment Among Seniors over 75 years
In terms of unemployment among seniors over 75 years, the demographic groups most similar to Immigrants from Czechoslovakia are Serbian (8.4%, a difference of 0.080%), Chilean (8.4%, a difference of 0.11%), German Russian (8.4%, a difference of 0.39%), Haitian (8.5%, a difference of 0.39%), and Apache (8.4%, a difference of 0.48%).
| Demographics | Rating | Rank | Unemployment Among Seniors over 75 years |
| Hondurans | 96.2 /100 | #127 | Exceptional 8.4% |
| Native Hawaiians | 96.1 /100 | #128 | Exceptional 8.4% |
| Ghanaians | 96.0 /100 | #129 | Exceptional 8.4% |
| Apache | 95.2 /100 | #130 | Exceptional 8.4% |
| German Russians | 94.9 /100 | #131 | Exceptional 8.4% |
| Chileans | 93.8 /100 | #132 | Exceptional 8.4% |
| Serbians | 93.7 /100 | #133 | Exceptional 8.4% |
| Immigrants | Czechoslovakia | 93.4 /100 | #134 | Exceptional 8.4% |
| Haitians | 91.4 /100 | #135 | Exceptional 8.5% |
| Immigrants | Trinidad and Tobago | 90.8 /100 | #136 | Exceptional 8.5% |
| Immigrants | Kuwait | 90.5 /100 | #137 | Exceptional 8.5% |
| Immigrants | Bulgaria | 89.6 /100 | #138 | Excellent 8.5% |
| Barbadians | 88.6 /100 | #139 | Excellent 8.5% |
| South Americans | 87.9 /100 | #140 | Excellent 8.5% |
| Immigrants | Bolivia | 87.9 /100 | #141 | Excellent 8.5% |