Bahamian vs Immigrants from Czechoslovakia Family Poverty

COMPARE

Bahamian
Race
Ancestry
AfghanAfricanAlaska NativeAlaskan AthabascanAlbanianAleutAlsatianAmericanApacheArabArapahoArgentineanArmenianAssyrian/Chaldean/SyriacAustralianAustrianBahamianBangladeshiBarbadianBasqueBelgianBelizeanBermudanBhutaneseBlackfeetBolivianBrazilianBritishBritish West IndianBulgarianBurmeseCajunCambodianCanadianCape VerdeanCarpatho RusynCelticCentral AmericanCentral American IndianCherokeeCheyenneChickasawChileanChineseChippewaChoctawColombianColvilleComancheCosta RicanCreeCreekCroatianCrowCubanCypriotCzechCzechoslovakianDanishDelawareDominicanDutchDutch West IndianEastern EuropeanEcuadorianEgyptianEnglishEstonianEthiopianEuropeanFijianFilipinoFinnishFrenchFrench American IndianFrench CanadianGermanGerman RussianGhanaianGreekGuamanian/ChamorroGuatemalanGuyaneseHaitianHmongHonduranHopiHoumaHungarianIcelanderIndian (Asian)IndonesianInupiatIranianIraqiIrishIroquoisIsraeliItalianJamaicanJapaneseJordanianKenyanKiowaKoreanLaotianLatvianLebaneseLiberianLithuanianLumbeeLuxembourgerMacedonianMalaysianMalteseMarshalleseMenomineeMexicanMexican American IndianMongolianMoroccanNative HawaiianNavajoNepaleseNew ZealanderNicaraguanNigerianNorthern EuropeanNorwegianOkinawanOsageOttawaPaiutePakistaniPalestinianPanamanianParaguayanPennsylvania GermanPeruvianPimaPolishPortuguesePotawatomiPuebloPuerto RicanPuget Sound SalishRomanianRussianSalvadoranSamoanScandinavianScotch-IrishScottishSeminoleSenegaleseSerbianShoshoneSierra LeoneanSiouxSlavicSlovakSloveneSomaliSouth AfricanSouth AmericanSouth American IndianSoviet UnionSpaniardSpanishSpanish AmericanSpanish American IndianSri LankanSubsaharan AfricanSudaneseSwedishSwissSyrianTaiwaneseThaiTlingit-HaidaTohono O'OdhamTonganTrinidadian and TobagonianTsimshianTurkishU.S. Virgin IslanderUgandanUkrainianUruguayanUteVenezuelanVietnameseWelshWest IndianYakamaYaquiYugoslavianYumanYup'ikZimbabwean
Immigration
NonimmigrantsImmigrantsAfghanistanAfricaAlbaniaArgentinaArmeniaAsiaAustraliaAustriaBahamasBangladeshBarbadosBelarusBelgiumBelizeBoliviaBosnia and HerzegovinaBrazilBulgariaBurma/MyanmarCabo VerdeCambodiaCameroonCanadaCaribbeanCentral AmericaChileChinaColombiaCongoCosta RicaCroatiaCubaDenmarkDominicaDominican RepublicEastern AfricaEastern AsiaEastern EuropeEcuadorEgyptEl SalvadorEnglandEritreaEthiopiaEuropeFijiFranceGermanyGhanaGreeceGrenadaGuatemalaGuyanaHaitiHondurasHong KongHungaryIndiaIndonesiaIranIraqIrelandIsraelItalyJamaicaJapanJordanKazakhstanKenyaKoreaKuwaitLaosLatin AmericaLatviaLebanonLiberiaLithuaniaMalaysiaMexicoMicronesiaMiddle AfricaMoldovaMoroccoNepalNetherlandsNicaraguaNigeriaNorth AmericaNorth MacedoniaNorthern AfricaNorthern EuropeNorwayOceaniaPakistanPanamaPeruPhilippinesPolandPortugalRomaniaRussiaSaudi ArabiaScotlandSenegalSerbiaSierra LeoneSingaporeSomaliaSouth AfricaSouth AmericaSouth Central AsiaSouth Eastern AsiaSouthern EuropeSpainSri LankaSt. Vincent and the GrenadinesSudanSwedenSwitzerlandSyriaTaiwanThailandTrinidad and TobagoTurkeyUgandaUkraineUruguayUzbekistanVenezuelaVietnamWest IndiesWestern AfricaWestern AsiaWestern EuropeYemenZaireZimbabweAzores
Immigrants from Czechoslovakia
Race
Ancestry
AfghanAfricanAlaska NativeAlaskan AthabascanAlbanianAleutAlsatianAmericanApacheArabArapahoArgentineanArmenianAssyrian/Chaldean/SyriacAustralianAustrianBangladeshiBarbadianBasqueBelgianBelizeanBermudanBhutaneseBlackfeetBolivianBrazilianBritishBritish West IndianBulgarianBurmeseCajunCambodianCanadianCape VerdeanCarpatho RusynCelticCentral AmericanCentral American IndianCherokeeCheyenneChickasawChileanChineseChippewaChoctawColombianColvilleComancheCosta RicanCreeCreekCroatianCrowCubanCypriotCzechCzechoslovakianDanishDelawareDominicanDutchDutch West IndianEastern EuropeanEcuadorianEgyptianEnglishEstonianEthiopianEuropeanFijianFilipinoFinnishFrenchFrench American IndianFrench CanadianGermanGerman RussianGhanaianGreekGuamanian/ChamorroGuatemalanGuyaneseHaitianHmongHonduranHopiHoumaHungarianIcelanderIndian (Asian)IndonesianInupiatIranianIraqiIrishIroquoisIsraeliItalianJamaicanJapaneseJordanianKenyanKiowaKoreanLaotianLatvianLebaneseLiberianLithuanianLumbeeLuxembourgerMacedonianMalaysianMalteseMarshalleseMenomineeMexicanMexican American IndianMongolianMoroccanNative HawaiianNavajoNepaleseNew ZealanderNicaraguanNigerianNorthern EuropeanNorwegianOkinawanOsageOttawaPaiutePakistaniPalestinianPanamanianParaguayanPennsylvania GermanPeruvianPimaPolishPortuguesePotawatomiPuebloPuerto RicanPuget Sound SalishRomanianRussianSalvadoranSamoanScandinavianScotch-IrishScottishSeminoleSenegaleseSerbianShoshoneSierra LeoneanSiouxSlavicSlovakSloveneSomaliSouth AfricanSouth AmericanSouth American IndianSoviet UnionSpaniardSpanishSpanish AmericanSpanish American IndianSri LankanSubsaharan AfricanSudaneseSwedishSwissSyrianTaiwaneseThaiTlingit-HaidaTohono O'OdhamTonganTrinidadian and TobagonianTsimshianTurkishU.S. Virgin IslanderUgandanUkrainianUruguayanUteVenezuelanVietnameseWelshWest IndianYakamaYaquiYugoslavianYumanYup'ikZimbabwean
Immigration
NonimmigrantsImmigrantsAfghanistanAfricaAlbaniaArgentinaArmeniaAsiaAustraliaAustriaBahamasBangladeshBarbadosBelarusBelgiumBelizeBoliviaBosnia and HerzegovinaBrazilBulgariaBurma/MyanmarCabo VerdeCambodiaCameroonCanadaCaribbeanCentral AmericaChileChinaColombiaCongoCosta RicaCroatiaCubaCzechoslovakiaDenmarkDominicaDominican RepublicEastern AfricaEastern AsiaEastern EuropeEcuadorEgyptEl SalvadorEnglandEritreaEthiopiaEuropeFijiFranceGermanyGhanaGreeceGrenadaGuatemalaGuyanaHaitiHondurasHong KongHungaryIndiaIndonesiaIranIraqIrelandIsraelItalyJamaicaJapanJordanKazakhstanKenyaKoreaKuwaitLaosLatin AmericaLatviaLebanonLiberiaLithuaniaMalaysiaMexicoMicronesiaMiddle AfricaMoldovaMoroccoNepalNetherlandsNicaraguaNigeriaNorth AmericaNorth MacedoniaNorthern AfricaNorthern EuropeNorwayOceaniaPakistanPanamaPeruPhilippinesPolandPortugalRomaniaRussiaSaudi ArabiaScotlandSenegalSerbiaSierra LeoneSingaporeSomaliaSouth AfricaSouth AmericaSouth Central AsiaSouth Eastern AsiaSouthern EuropeSpainSri LankaSt. Vincent and the GrenadinesSudanSwedenSwitzerlandSyriaTaiwanThailandTrinidad and TobagoTurkeyUgandaUkraineUruguayUzbekistanVenezuelaVietnamWest IndiesWestern AfricaWestern AsiaWestern EuropeYemenZaireZimbabweAzores
Family Poverty
Income
Poverty
Unemployment
Labor Participation
Family Structure
Vehicle Availability
Education Level
Disability

Family Poverty Comparison

Bahamians

Immigrants from Czechoslovakia

Tragic
Exceptional
11.7%
FAMILY POVERTY
0.0/ 100
METRIC RATING
301st/ 347
METRIC RANK
7.7%
FAMILY POVERTY
98.9/ 100
METRIC RATING
47th/ 347
METRIC RANK

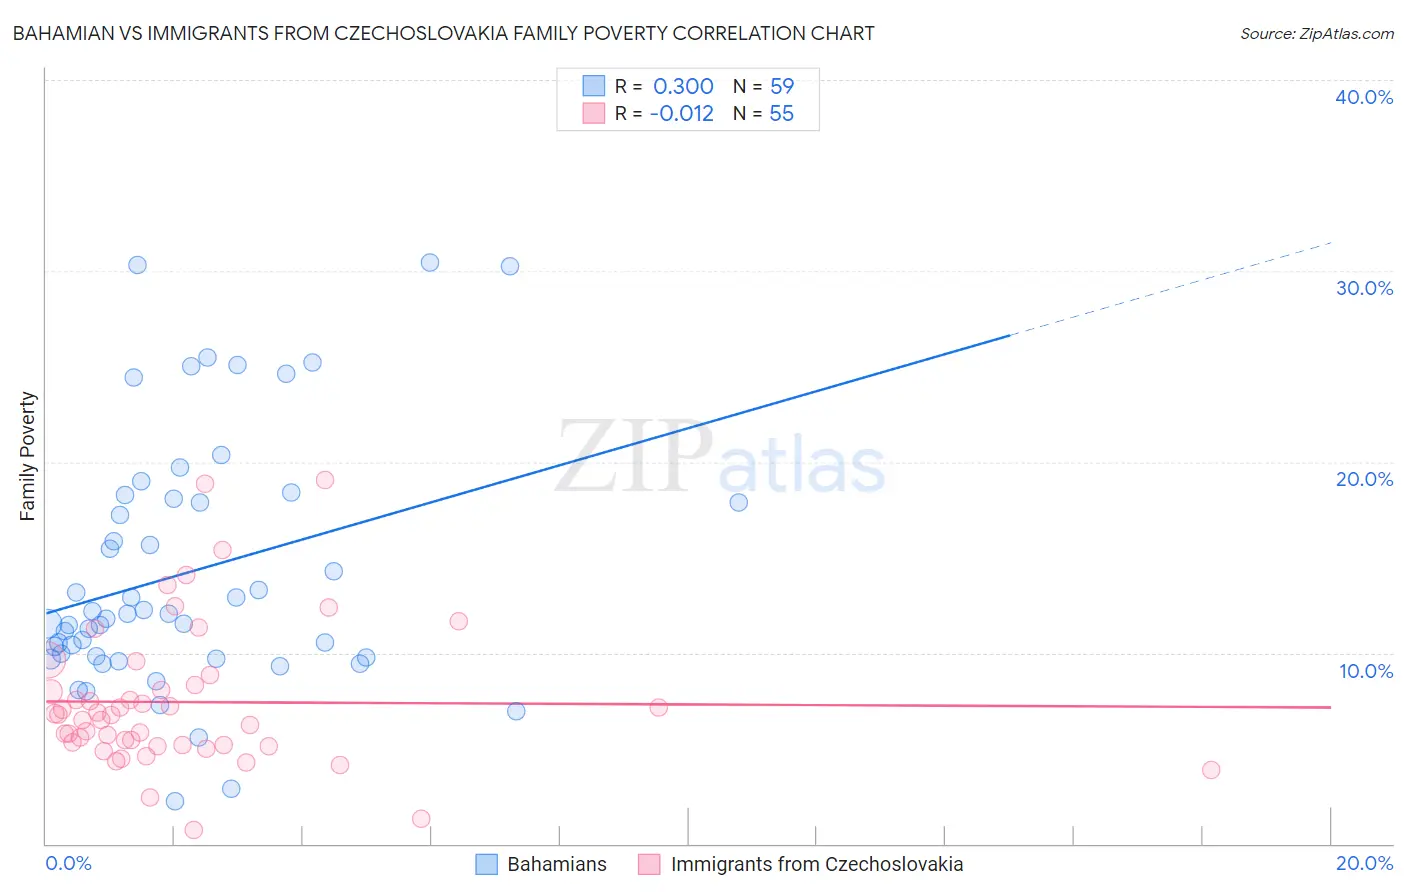
Bahamian vs Immigrants from Czechoslovakia Family Poverty Correlation Chart

The statistical analysis conducted on geographies consisting of 112,580,407 people shows a weak positive correlation between the proportion of Bahamians and poverty level among families in the United States with a correlation coefficient (R) of 0.300 and weighted average of 11.7%. Similarly, the statistical analysis conducted on geographies consisting of 195,180,585 people shows no correlation between the proportion of Immigrants from Czechoslovakia and poverty level among families in the United States with a correlation coefficient (R) of -0.012 and weighted average of 7.7%, a difference of 52.7%.
Bahamian vs Immigrants from Czechoslovakia Family Poverty

Family Poverty Correlation Summary

MeasurementBahamianImmigrants from Czechoslovakia
Minimum2.2%0.73%
Maximum30.4%19.0%
Range28.2%18.3%
Mean14.2%7.4%
Median12.1%6.7%
Interquartile 25% (IQ1)9.7%5.2%
Interquartile 75% (IQ3)18.1%8.3%
Interquartile Range (IQR)8.3%3.1%
Standard Deviation (Sample)6.6%3.7%
Standard Deviation (Population)6.6%3.7%

Similar Demographics by Family Poverty

Demographics Similar to Bahamians by Family Poverty

In terms of family poverty, the demographic groups most similar to Bahamians are Guatemalan (11.7%, a difference of 0.040%), Immigrants from Bangladesh (11.7%, a difference of 0.25%), Dutch West Indian (11.7%, a difference of 0.27%), Immigrants from Senegal (11.7%, a difference of 0.36%), and Creek (11.7%, a difference of 0.50%).
DemographicsRating | RankFamily Poverty
Immigrants | St. Vincent and the Grenadines
0.0
/100
|
#294
Tragic
11.6%
Immigrants | Haiti
0.0
/100
|
#295
Tragic
11.6%
Choctaw
0.0
/100
|
#296
Tragic
11.6%
Creek
0.0
/100
|
#297
Tragic
11.7%
Immigrants | Senegal
0.0
/100
|
#298
Tragic
11.7%
Dutch West Indians
0.0
/100
|
#299
Tragic
11.7%
Immigrants | Bangladesh
0.0
/100
|
#300
Tragic
11.7%
Bahamians
0.0
/100
|
#301
Tragic
11.7%
Guatemalans
0.0
/100
|
#302
Tragic
11.7%
Africans
0.0
/100
|
#303
Tragic
11.8%
Immigrants | Latin America
0.0
/100
|
#304
Tragic
11.8%
Mexicans
0.0
/100
|
#305
Tragic
11.8%
Cajuns
0.0
/100
|
#306
Tragic
11.9%
Immigrants | Congo
0.0
/100
|
#307
Tragic
11.9%
Seminole
0.0
/100
|
#308
Tragic
11.9%

Demographics Similar to Immigrants from Czechoslovakia by Family Poverty

In terms of family poverty, the demographic groups most similar to Immigrants from Czechoslovakia are Tongan (7.7%, a difference of 0.010%), Immigrants from Sri Lanka (7.7%, a difference of 0.020%), Okinawan (7.7%, a difference of 0.030%), German (7.7%, a difference of 0.15%), and Immigrants from Bolivia (7.7%, a difference of 0.20%).
DemographicsRating | RankFamily Poverty
Slovenes
99.3
/100
|
#40
Exceptional
7.5%
Immigrants | Australia
99.2
/100
|
#41
Exceptional
7.6%
Scandinavians
99.1
/100
|
#42
Exceptional
7.6%
Immigrants | Austria
99.1
/100
|
#43
Exceptional
7.6%
Germans
99.0
/100
|
#44
Exceptional
7.7%
Okinawans
98.9
/100
|
#45
Exceptional
7.7%
Tongans
98.9
/100
|
#46
Exceptional
7.7%
Immigrants | Czechoslovakia
98.9
/100
|
#47
Exceptional
7.7%
Immigrants | Sri Lanka
98.9
/100
|
#48
Exceptional
7.7%
Immigrants | Bolivia
98.9
/100
|
#49
Exceptional
7.7%
Immigrants | North Macedonia
98.9
/100
|
#50
Exceptional
7.7%
Immigrants | Moldova
98.8
/100
|
#51
Exceptional
7.7%
Indians (Asian)
98.8
/100
|
#52
Exceptional
7.7%
Swiss
98.8
/100
|
#53
Exceptional
7.7%
Immigrants | Sweden
98.8
/100
|
#54
Exceptional
7.7%