Immigrants from Belarus vs Immigrants from Czechoslovakia 2 or more Vehicles in Household
COMPARE
Immigrants from Belarus
Immigrants from Czechoslovakia
2 or more Vehicles in Household
2 or more Vehicles in Household Comparison
Immigrants from Belarus
Immigrants from Czechoslovakia
47.9%
2 OR MORE VEHICLES IN HOUSEHOLD
0.0/ 100
METRIC RATING
311th/ 347
METRIC RANK
54.1%
2 OR MORE VEHICLES IN HOUSEHOLD
9.4/ 100
METRIC RATING
214th/ 347
METRIC RANK
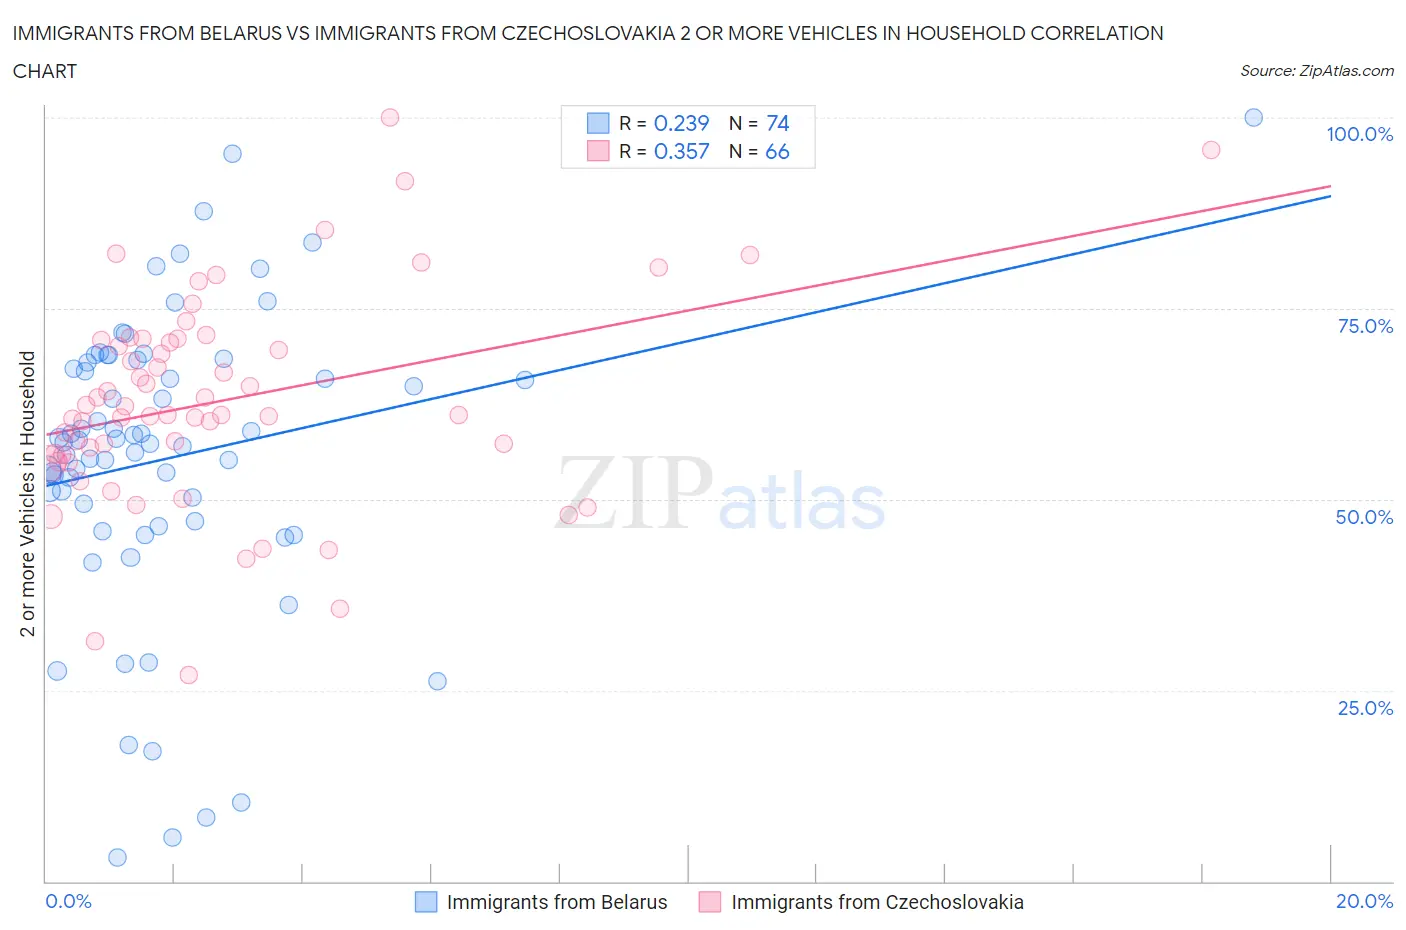
Immigrants from Belarus vs Immigrants from Czechoslovakia 2 or more Vehicles in Household Correlation Chart
The statistical analysis conducted on geographies consisting of 150,189,140 people shows a weak positive correlation between the proportion of Immigrants from Belarus and percentage of households with 2 or more vehicles available in the United States with a correlation coefficient (R) of 0.239 and weighted average of 47.9%. Similarly, the statistical analysis conducted on geographies consisting of 195,452,090 people shows a mild positive correlation between the proportion of Immigrants from Czechoslovakia and percentage of households with 2 or more vehicles available in the United States with a correlation coefficient (R) of 0.357 and weighted average of 54.1%, a difference of 12.9%.
2 or more Vehicles in Household Correlation Summary
| Measurement | Immigrants from Belarus | Immigrants from Czechoslovakia |
| Minimum | 3.0% | 27.0% |
| Maximum | 100.0% | 100.0% |
| Range | 97.0% | 73.0% |
| Mean | 55.5% | 62.9% |
| Median | 57.6% | 61.1% |
| Interquartile 25% (IQ1) | 47.1% | 55.8% |
| Interquartile 75% (IQ3) | 67.9% | 70.9% |
| Interquartile Range (IQR) | 20.9% | 15.1% |
| Standard Deviation (Sample) | 19.6% | 13.9% |
| Standard Deviation (Population) | 19.4% | 13.8% |
Similar Demographics by 2 or more Vehicles in Household
Demographics Similar to Immigrants from Belarus by 2 or more Vehicles in Household
In terms of 2 or more vehicles in household, the demographic groups most similar to Immigrants from Belarus are Ghanaian (48.0%, a difference of 0.12%), Haitian (47.6%, a difference of 0.74%), U.S. Virgin Islander (47.5%, a difference of 0.91%), Immigrants from Ghana (47.4%, a difference of 1.1%), and Puerto Rican (47.1%, a difference of 1.7%).
| Demographics | Rating | Rank | 2 or more Vehicles in Household |
| Immigrants | Belize | 0.0 /100 | #304 | Tragic 49.9% |
| Immigrants | Western Africa | 0.0 /100 | #305 | Tragic 49.4% |
| Immigrants | Israel | 0.0 /100 | #306 | Tragic 49.2% |
| Hopi | 0.0 /100 | #307 | Tragic 49.0% |
| Albanians | 0.0 /100 | #308 | Tragic 49.0% |
| Moroccans | 0.0 /100 | #309 | Tragic 48.8% |
| Ghanaians | 0.0 /100 | #310 | Tragic 48.0% |
| Immigrants | Belarus | 0.0 /100 | #311 | Tragic 47.9% |
| Haitians | 0.0 /100 | #312 | Tragic 47.6% |
| U.S. Virgin Islanders | 0.0 /100 | #313 | Tragic 47.5% |
| Immigrants | Ghana | 0.0 /100 | #314 | Tragic 47.4% |
| Puerto Ricans | 0.0 /100 | #315 | Tragic 47.1% |
| Cape Verdeans | 0.0 /100 | #316 | Tragic 46.8% |
| Immigrants | Haiti | 0.0 /100 | #317 | Tragic 46.5% |
| Immigrants | Albania | 0.0 /100 | #318 | Tragic 46.0% |
Demographics Similar to Immigrants from Czechoslovakia by 2 or more Vehicles in Household
In terms of 2 or more vehicles in household, the demographic groups most similar to Immigrants from Czechoslovakia are Aleut (54.1%, a difference of 0.010%), Guatemalan (54.1%, a difference of 0.020%), Immigrants from Western Asia (54.1%, a difference of 0.020%), Immigrants from Chile (54.2%, a difference of 0.18%), and Immigrants from Saudi Arabia (54.2%, a difference of 0.21%).
| Demographics | Rating | Rank | 2 or more Vehicles in Household |
| Turks | 13.0 /100 | #207 | Poor 54.3% |
| Egyptians | 12.0 /100 | #208 | Poor 54.3% |
| Immigrants | Bulgaria | 12.0 /100 | #209 | Poor 54.3% |
| Immigrants | Saudi Arabia | 11.3 /100 | #210 | Poor 54.2% |
| Immigrants | Hungary | 11.3 /100 | #211 | Poor 54.2% |
| Immigrants | Chile | 11.1 /100 | #212 | Poor 54.2% |
| Guatemalans | 9.6 /100 | #213 | Tragic 54.1% |
| Immigrants | Czechoslovakia | 9.4 /100 | #214 | Tragic 54.1% |
| Aleuts | 9.3 /100 | #215 | Tragic 54.1% |
| Immigrants | Western Asia | 9.3 /100 | #216 | Tragic 54.1% |
| Immigrants | Burma/Myanmar | 7.1 /100 | #217 | Tragic 53.9% |
| Immigrants | Argentina | 6.8 /100 | #218 | Tragic 53.9% |
| South American Indians | 6.5 /100 | #219 | Tragic 53.9% |
| Taiwanese | 6.3 /100 | #220 | Tragic 53.9% |
| Immigrants | Singapore | 6.3 /100 | #221 | Tragic 53.9% |