Pakistani vs Immigrants from Czechoslovakia 2 or more Vehicles in Household
COMPARE
Pakistani
Immigrants from Czechoslovakia
2 or more Vehicles in Household
2 or more Vehicles in Household Comparison
Pakistanis
Immigrants from Czechoslovakia
57.9%
2 OR MORE VEHICLES IN HOUSEHOLD
99.0/ 100
METRIC RATING
91st/ 347
METRIC RANK
54.1%
2 OR MORE VEHICLES IN HOUSEHOLD
9.4/ 100
METRIC RATING
214th/ 347
METRIC RANK
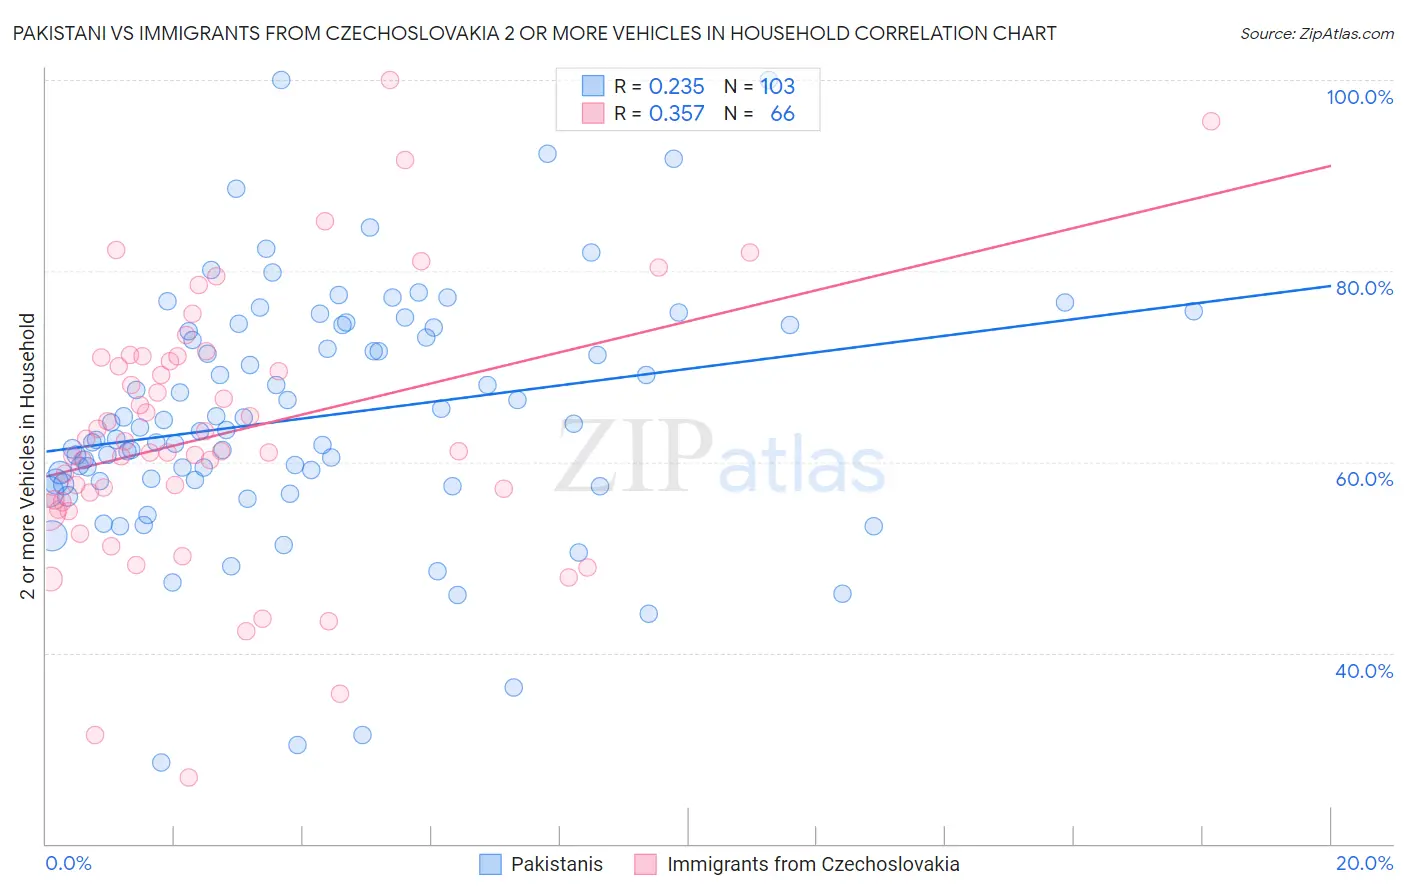
Pakistani vs Immigrants from Czechoslovakia 2 or more Vehicles in Household Correlation Chart
The statistical analysis conducted on geographies consisting of 335,209,780 people shows a weak positive correlation between the proportion of Pakistanis and percentage of households with 2 or more vehicles available in the United States with a correlation coefficient (R) of 0.235 and weighted average of 57.9%. Similarly, the statistical analysis conducted on geographies consisting of 195,452,090 people shows a mild positive correlation between the proportion of Immigrants from Czechoslovakia and percentage of households with 2 or more vehicles available in the United States with a correlation coefficient (R) of 0.357 and weighted average of 54.1%, a difference of 7.0%.
2 or more Vehicles in Household Correlation Summary
| Measurement | Pakistani | Immigrants from Czechoslovakia |
| Minimum | 28.5% | 27.0% |
| Maximum | 100.0% | 100.0% |
| Range | 71.5% | 73.0% |
| Mean | 64.7% | 62.9% |
| Median | 63.3% | 61.1% |
| Interquartile 25% (IQ1) | 57.9% | 55.8% |
| Interquartile 75% (IQ3) | 74.1% | 70.9% |
| Interquartile Range (IQR) | 16.1% | 15.1% |
| Standard Deviation (Sample) | 12.9% | 13.9% |
| Standard Deviation (Population) | 12.9% | 13.8% |
Similar Demographics by 2 or more Vehicles in Household
Demographics Similar to Pakistanis by 2 or more Vehicles in Household
In terms of 2 or more vehicles in household, the demographic groups most similar to Pakistanis are Shoshone (57.9%, a difference of 0.020%), Immigrants from Germany (57.9%, a difference of 0.030%), Hispanic or Latino (57.9%, a difference of 0.030%), Ottawa (57.9%, a difference of 0.030%), and Immigrants from Iran (57.9%, a difference of 0.090%).
| Demographics | Rating | Rank | 2 or more Vehicles in Household |
| Maltese | 99.2 /100 | #84 | Exceptional 58.0% |
| Slovaks | 99.2 /100 | #85 | Exceptional 58.0% |
| Potawatomi | 99.1 /100 | #86 | Exceptional 58.0% |
| Thais | 99.1 /100 | #87 | Exceptional 57.9% |
| Immigrants | Iran | 99.1 /100 | #88 | Exceptional 57.9% |
| Immigrants | Germany | 99.0 /100 | #89 | Exceptional 57.9% |
| Hispanics or Latinos | 99.0 /100 | #90 | Exceptional 57.9% |
| Pakistanis | 99.0 /100 | #91 | Exceptional 57.9% |
| Shoshone | 99.0 /100 | #92 | Exceptional 57.9% |
| Ottawa | 99.0 /100 | #93 | Exceptional 57.9% |
| Filipinos | 98.9 /100 | #94 | Exceptional 57.8% |
| Hmong | 98.9 /100 | #95 | Exceptional 57.8% |
| Burmese | 98.8 /100 | #96 | Exceptional 57.8% |
| Slavs | 98.8 /100 | #97 | Exceptional 57.8% |
| Palestinians | 98.6 /100 | #98 | Exceptional 57.7% |
Demographics Similar to Immigrants from Czechoslovakia by 2 or more Vehicles in Household
In terms of 2 or more vehicles in household, the demographic groups most similar to Immigrants from Czechoslovakia are Aleut (54.1%, a difference of 0.010%), Guatemalan (54.1%, a difference of 0.020%), Immigrants from Western Asia (54.1%, a difference of 0.020%), Immigrants from Chile (54.2%, a difference of 0.18%), and Immigrants from Saudi Arabia (54.2%, a difference of 0.21%).
| Demographics | Rating | Rank | 2 or more Vehicles in Household |
| Turks | 13.0 /100 | #207 | Poor 54.3% |
| Egyptians | 12.0 /100 | #208 | Poor 54.3% |
| Immigrants | Bulgaria | 12.0 /100 | #209 | Poor 54.3% |
| Immigrants | Saudi Arabia | 11.3 /100 | #210 | Poor 54.2% |
| Immigrants | Hungary | 11.3 /100 | #211 | Poor 54.2% |
| Immigrants | Chile | 11.1 /100 | #212 | Poor 54.2% |
| Guatemalans | 9.6 /100 | #213 | Tragic 54.1% |
| Immigrants | Czechoslovakia | 9.4 /100 | #214 | Tragic 54.1% |
| Aleuts | 9.3 /100 | #215 | Tragic 54.1% |
| Immigrants | Western Asia | 9.3 /100 | #216 | Tragic 54.1% |
| Immigrants | Burma/Myanmar | 7.1 /100 | #217 | Tragic 53.9% |
| Immigrants | Argentina | 6.8 /100 | #218 | Tragic 53.9% |
| South American Indians | 6.5 /100 | #219 | Tragic 53.9% |
| Taiwanese | 6.3 /100 | #220 | Tragic 53.9% |
| Immigrants | Singapore | 6.3 /100 | #221 | Tragic 53.9% |