Immigrants from Colombia vs English 3 or more Vehicles in Household
COMPARE
Immigrants from Colombia
English
3 or more Vehicles in Household
3 or more Vehicles in Household Comparison
Immigrants from Colombia
English
17.3%
3 OR MORE VEHICLES IN HOUSEHOLD
0.3/ 100
METRIC RATING
284th/ 347
METRIC RANK
23.1%
3 OR MORE VEHICLES IN HOUSEHOLD
100.0/ 100
METRIC RATING
31st/ 347
METRIC RANK
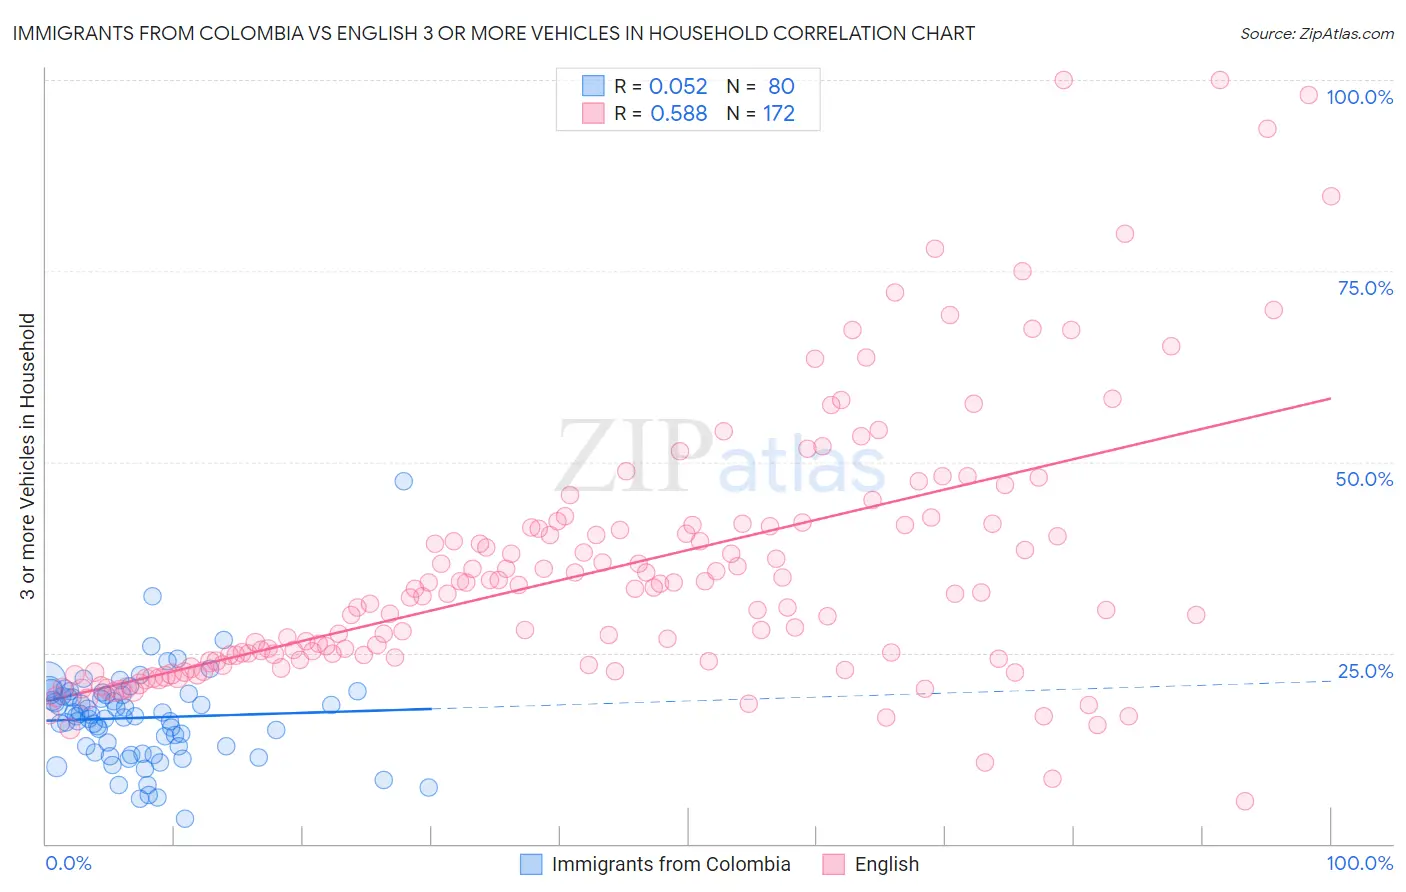
Immigrants from Colombia vs English 3 or more Vehicles in Household Correlation Chart
The statistical analysis conducted on geographies consisting of 378,439,541 people shows a slight positive correlation between the proportion of Immigrants from Colombia and percentage of households with 3 or more vehicles available in the United States with a correlation coefficient (R) of 0.052 and weighted average of 17.3%. Similarly, the statistical analysis conducted on geographies consisting of 578,919,458 people shows a substantial positive correlation between the proportion of English and percentage of households with 3 or more vehicles available in the United States with a correlation coefficient (R) of 0.588 and weighted average of 23.1%, a difference of 33.2%.
3 or more Vehicles in Household Correlation Summary
| Measurement | Immigrants from Colombia | English |
| Minimum | 3.3% | 5.6% |
| Maximum | 47.5% | 100.0% |
| Range | 44.2% | 94.4% |
| Mean | 16.5% | 36.0% |
| Median | 16.7% | 32.8% |
| Interquartile 25% (IQ1) | 12.4% | 23.9% |
| Interquartile 75% (IQ3) | 19.5% | 41.7% |
| Interquartile Range (IQR) | 7.1% | 17.7% |
| Standard Deviation (Sample) | 6.3% | 17.5% |
| Standard Deviation (Population) | 6.2% | 17.5% |
Similar Demographics by 3 or more Vehicles in Household
Demographics Similar to Immigrants from Colombia by 3 or more Vehicles in Household
In terms of 3 or more vehicles in household, the demographic groups most similar to Immigrants from Colombia are Black/African American (17.3%, a difference of 0.12%), Immigrants from Ireland (17.3%, a difference of 0.17%), Immigrants from Latvia (17.4%, a difference of 0.46%), Immigrants from Eastern Europe (17.4%, a difference of 0.50%), and Immigrants from Kazakhstan (17.4%, a difference of 0.54%).
| Demographics | Rating | Rank | 3 or more Vehicles in Household |
| Brazilians | 0.4 /100 | #277 | Tragic 17.4% |
| Immigrants | Bahamas | 0.3 /100 | #278 | Tragic 17.4% |
| Immigrants | Kazakhstan | 0.3 /100 | #279 | Tragic 17.4% |
| Immigrants | Eastern Europe | 0.3 /100 | #280 | Tragic 17.4% |
| Immigrants | Latvia | 0.3 /100 | #281 | Tragic 17.4% |
| Immigrants | Ireland | 0.3 /100 | #282 | Tragic 17.3% |
| Blacks/African Americans | 0.3 /100 | #283 | Tragic 17.3% |
| Immigrants | Colombia | 0.3 /100 | #284 | Tragic 17.3% |
| Immigrants | Croatia | 0.2 /100 | #285 | Tragic 17.2% |
| Menominee | 0.2 /100 | #286 | Tragic 17.2% |
| Immigrants | Brazil | 0.2 /100 | #287 | Tragic 17.1% |
| Immigrants | Uruguay | 0.2 /100 | #288 | Tragic 17.1% |
| Immigrants | Liberia | 0.1 /100 | #289 | Tragic 17.1% |
| Liberians | 0.1 /100 | #290 | Tragic 17.0% |
| Immigrants | Congo | 0.1 /100 | #291 | Tragic 17.0% |
Demographics Similar to English by 3 or more Vehicles in Household
In terms of 3 or more vehicles in household, the demographic groups most similar to English are Pueblo (23.0%, a difference of 0.090%), Spanish American (23.0%, a difference of 0.15%), Immigrants from South Eastern Asia (23.1%, a difference of 0.19%), Swiss (23.0%, a difference of 0.20%), and Choctaw (23.0%, a difference of 0.22%).
| Demographics | Rating | Rank | 3 or more Vehicles in Household |
| Sri Lankans | 100.0 /100 | #24 | Exceptional 23.6% |
| Immigrants | Central America | 100.0 /100 | #25 | Exceptional 23.4% |
| Mexican American Indians | 100.0 /100 | #26 | Exceptional 23.3% |
| Guamanians/Chamorros | 100.0 /100 | #27 | Exceptional 23.2% |
| Lumbee | 100.0 /100 | #28 | Exceptional 23.1% |
| Spanish | 100.0 /100 | #29 | Exceptional 23.1% |
| Immigrants | South Eastern Asia | 100.0 /100 | #30 | Exceptional 23.1% |
| English | 100.0 /100 | #31 | Exceptional 23.1% |
| Pueblo | 100.0 /100 | #32 | Exceptional 23.0% |
| Spanish Americans | 100.0 /100 | #33 | Exceptional 23.0% |
| Swiss | 100.0 /100 | #34 | Exceptional 23.0% |
| Choctaw | 100.0 /100 | #35 | Exceptional 23.0% |
| Cherokee | 100.0 /100 | #36 | Exceptional 23.0% |
| Swedes | 100.0 /100 | #37 | Exceptional 23.0% |
| Dutch | 100.0 /100 | #38 | Exceptional 22.9% |