African vs Chickasaw Unemployment
COMPARE
African
Chickasaw
Unemployment
Unemployment Comparison
Africans
Chickasaw
6.1%
UNEMPLOYMENT
0.0/ 100
METRIC RATING
281st/ 347
METRIC RANK
5.0%
UNEMPLOYMENT
94.0/ 100
METRIC RATING
103rd/ 347
METRIC RANK
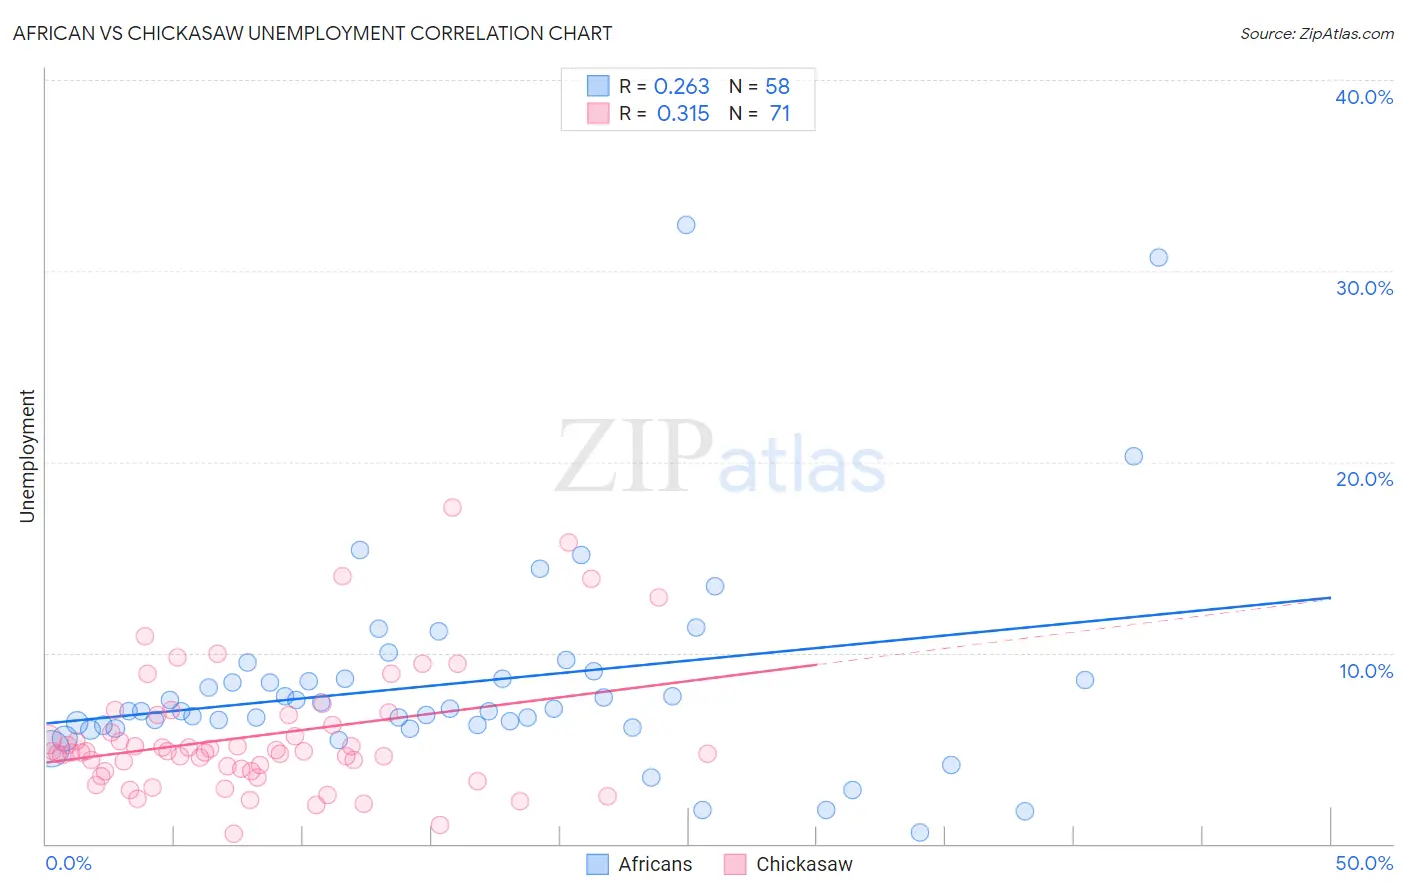
African vs Chickasaw Unemployment Correlation Chart
The statistical analysis conducted on geographies consisting of 469,312,899 people shows a weak positive correlation between the proportion of Africans and unemployment in the United States with a correlation coefficient (R) of 0.263 and weighted average of 6.1%. Similarly, the statistical analysis conducted on geographies consisting of 147,562,181 people shows a mild positive correlation between the proportion of Chickasaw and unemployment in the United States with a correlation coefficient (R) of 0.315 and weighted average of 5.0%, a difference of 20.2%.
Unemployment Correlation Summary
| Measurement | African | Chickasaw |
| Minimum | 0.60% | 0.50% |
| Maximum | 32.4% | 17.6% |
| Range | 31.8% | 17.1% |
| Mean | 8.4% | 5.6% |
| Median | 7.0% | 4.8% |
| Interquartile 25% (IQ1) | 6.2% | 3.8% |
| Interquartile 75% (IQ3) | 8.6% | 6.7% |
| Interquartile Range (IQR) | 2.4% | 2.9% |
| Standard Deviation (Sample) | 5.6% | 3.3% |
| Standard Deviation (Population) | 5.5% | 3.3% |
Similar Demographics by Unemployment
Demographics Similar to Africans by Unemployment
In terms of unemployment, the demographic groups most similar to Africans are Immigrants from the Azores (6.1%, a difference of 0.060%), Immigrants from Ghana (6.1%, a difference of 0.15%), Aleut (6.1%, a difference of 0.28%), Immigrants from Mexico (6.0%, a difference of 0.58%), and Immigrants from Western Africa (6.0%, a difference of 0.58%).
| Demographics | Rating | Rank | Unemployment |
| Bahamians | 0.0 /100 | #274 | Tragic 5.9% |
| Immigrants | Latin America | 0.0 /100 | #275 | Tragic 5.9% |
| Immigrants | Central America | 0.0 /100 | #276 | Tragic 6.0% |
| Armenians | 0.0 /100 | #277 | Tragic 6.0% |
| Ghanaians | 0.0 /100 | #278 | Tragic 6.0% |
| Immigrants | Mexico | 0.0 /100 | #279 | Tragic 6.0% |
| Immigrants | Western Africa | 0.0 /100 | #280 | Tragic 6.0% |
| Africans | 0.0 /100 | #281 | Tragic 6.1% |
| Immigrants | Azores | 0.0 /100 | #282 | Tragic 6.1% |
| Immigrants | Ghana | 0.0 /100 | #283 | Tragic 6.1% |
| Aleuts | 0.0 /100 | #284 | Tragic 6.1% |
| Immigrants | Senegal | 0.0 /100 | #285 | Tragic 6.1% |
| Immigrants | Caribbean | 0.0 /100 | #286 | Tragic 6.2% |
| Nepalese | 0.0 /100 | #287 | Tragic 6.2% |
| Ecuadorians | 0.0 /100 | #288 | Tragic 6.2% |
Demographics Similar to Chickasaw by Unemployment
In terms of unemployment, the demographic groups most similar to Chickasaw are Osage (5.0%, a difference of 0.0%), Maltese (5.0%, a difference of 0.0%), Immigrants from Argentina (5.0%, a difference of 0.040%), Immigrants from Romania (5.0%, a difference of 0.070%), and American (5.0%, a difference of 0.080%).
| Demographics | Rating | Rank | Unemployment |
| Immigrants | England | 95.2 /100 | #96 | Exceptional 5.0% |
| Immigrants | Czechoslovakia | 95.1 /100 | #97 | Exceptional 5.0% |
| Romanians | 95.0 /100 | #98 | Exceptional 5.0% |
| Mongolians | 94.8 /100 | #99 | Exceptional 5.0% |
| Estonians | 94.6 /100 | #100 | Exceptional 5.0% |
| Americans | 94.3 /100 | #101 | Exceptional 5.0% |
| Immigrants | Argentina | 94.1 /100 | #102 | Exceptional 5.0% |
| Chickasaw | 94.0 /100 | #103 | Exceptional 5.0% |
| Osage | 94.0 /100 | #104 | Exceptional 5.0% |
| Maltese | 94.0 /100 | #105 | Exceptional 5.0% |
| Immigrants | Romania | 93.7 /100 | #106 | Exceptional 5.0% |
| Immigrants | Turkey | 93.7 /100 | #107 | Exceptional 5.0% |
| Immigrants | Kuwait | 93.7 /100 | #108 | Exceptional 5.0% |
| Immigrants | Eritrea | 93.3 /100 | #109 | Exceptional 5.0% |
| Immigrants | Lithuania | 93.2 /100 | #110 | Exceptional 5.0% |