African vs Chickasaw 1 or more Vehicles in Household
COMPARE
African
Chickasaw
1 or more Vehicles in Household
1 or more Vehicles in Household Comparison
Africans
Chickasaw
87.8%
1 OR MORE VEHICLES IN HOUSEHOLD
0.4/ 100
METRIC RATING
265th/ 347
METRIC RANK
92.3%
1 OR MORE VEHICLES IN HOUSEHOLD
99.9/ 100
METRIC RATING
42nd/ 347
METRIC RANK
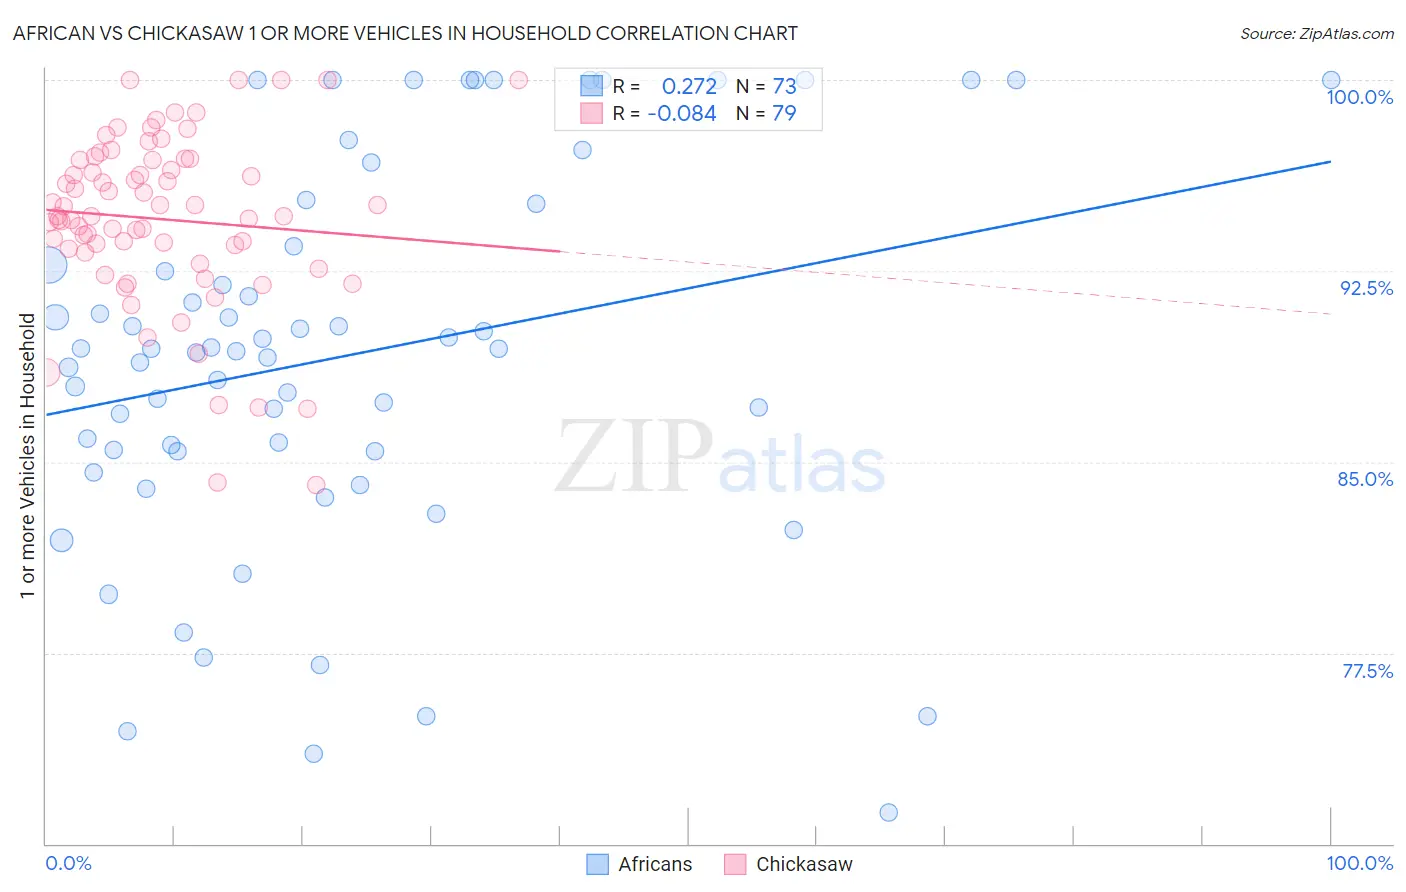
African vs Chickasaw 1 or more Vehicles in Household Correlation Chart
The statistical analysis conducted on geographies consisting of 469,659,613 people shows a weak positive correlation between the proportion of Africans and percentage of households with 1 or more vehicles available in the United States with a correlation coefficient (R) of 0.272 and weighted average of 87.8%. Similarly, the statistical analysis conducted on geographies consisting of 147,674,268 people shows a slight negative correlation between the proportion of Chickasaw and percentage of households with 1 or more vehicles available in the United States with a correlation coefficient (R) of -0.084 and weighted average of 92.3%, a difference of 5.1%.
1 or more Vehicles in Household Correlation Summary
| Measurement | African | Chickasaw |
| Minimum | 71.2% | 84.1% |
| Maximum | 100.0% | 100.0% |
| Range | 28.8% | 15.9% |
| Mean | 89.2% | 94.5% |
| Median | 89.4% | 94.7% |
| Interquartile 25% (IQ1) | 85.4% | 93.2% |
| Interquartile 75% (IQ3) | 94.3% | 96.8% |
| Interquartile Range (IQR) | 8.9% | 3.6% |
| Standard Deviation (Sample) | 7.4% | 3.4% |
| Standard Deviation (Population) | 7.4% | 3.4% |
Similar Demographics by 1 or more Vehicles in Household
Demographics Similar to Africans by 1 or more Vehicles in Household
In terms of 1 or more vehicles in household, the demographic groups most similar to Africans are Immigrants from Liberia (87.8%, a difference of 0.020%), Immigrants from Egypt (87.8%, a difference of 0.040%), Subsaharan African (87.9%, a difference of 0.11%), Immigrants from Switzerland (87.9%, a difference of 0.14%), and Israeli (87.7%, a difference of 0.14%).
| Demographics | Rating | Rank | 1 or more Vehicles in Household |
| South American Indians | 0.9 /100 | #258 | Tragic 88.0% |
| Nigerians | 0.8 /100 | #259 | Tragic 88.0% |
| Macedonians | 0.6 /100 | #260 | Tragic 87.9% |
| Immigrants | Switzerland | 0.6 /100 | #261 | Tragic 87.9% |
| Sub-Saharan Africans | 0.5 /100 | #262 | Tragic 87.9% |
| Immigrants | Egypt | 0.5 /100 | #263 | Tragic 87.8% |
| Immigrants | Liberia | 0.4 /100 | #264 | Tragic 87.8% |
| Africans | 0.4 /100 | #265 | Tragic 87.8% |
| Israelis | 0.3 /100 | #266 | Tragic 87.7% |
| Immigrants | Colombia | 0.3 /100 | #267 | Tragic 87.6% |
| Immigrants | Europe | 0.2 /100 | #268 | Tragic 87.6% |
| Immigrants | Africa | 0.2 /100 | #269 | Tragic 87.6% |
| Panamanians | 0.2 /100 | #270 | Tragic 87.5% |
| Bermudans | 0.2 /100 | #271 | Tragic 87.5% |
| Aleuts | 0.2 /100 | #272 | Tragic 87.5% |
Demographics Similar to Chickasaw by 1 or more Vehicles in Household
In terms of 1 or more vehicles in household, the demographic groups most similar to Chickasaw are Spanish (92.3%, a difference of 0.0%), Immigrants from Taiwan (92.3%, a difference of 0.010%), Choctaw (92.2%, a difference of 0.020%), Swiss (92.3%, a difference of 0.030%), and Creek (92.3%, a difference of 0.030%).
| Demographics | Rating | Rank | 1 or more Vehicles in Household |
| Czechoslovakians | 99.9 /100 | #35 | Exceptional 92.3% |
| Malaysians | 99.9 /100 | #36 | Exceptional 92.3% |
| French Canadians | 99.9 /100 | #37 | Exceptional 92.3% |
| Immigrants | Vietnam | 99.9 /100 | #38 | Exceptional 92.3% |
| Swiss | 99.9 /100 | #39 | Exceptional 92.3% |
| Creek | 99.9 /100 | #40 | Exceptional 92.3% |
| Immigrants | Taiwan | 99.9 /100 | #41 | Exceptional 92.3% |
| Chickasaw | 99.9 /100 | #42 | Exceptional 92.3% |
| Spanish | 99.9 /100 | #43 | Exceptional 92.3% |
| Choctaw | 99.9 /100 | #44 | Exceptional 92.2% |
| Immigrants | Nonimmigrants | 99.9 /100 | #45 | Exceptional 92.2% |
| Immigrants | Fiji | 99.9 /100 | #46 | Exceptional 92.2% |
| Northern Europeans | 99.9 /100 | #47 | Exceptional 92.2% |
| Belgians | 99.9 /100 | #48 | Exceptional 92.1% |
| Afghans | 99.9 /100 | #49 | Exceptional 92.1% |