Immigrants from Brazil vs Czechoslovakian Unemployment

COMPARE

Immigrants from Brazil
Race
Ancestry
AfghanAfricanAlaska NativeAlaskan AthabascanAlbanianAleutAlsatianAmericanApacheArabArapahoArgentineanArmenianAssyrian/Chaldean/SyriacAustralianAustrianBahamianBangladeshiBarbadianBasqueBelgianBelizeanBermudanBhutaneseBlackfeetBolivianBrazilianBritishBritish West IndianBulgarianBurmeseCajunCambodianCanadianCape VerdeanCarpatho RusynCelticCentral AmericanCentral American IndianCherokeeCheyenneChickasawChileanChineseChippewaChoctawColombianColvilleComancheCosta RicanCreeCreekCroatianCrowCubanCypriotCzechDanishDelawareDominicanDutchDutch West IndianEastern EuropeanEcuadorianEgyptianEnglishEstonianEthiopianEuropeanFijianFilipinoFinnishFrenchFrench American IndianFrench CanadianGermanGerman RussianGhanaianGreekGuamanian/ChamorroGuatemalanGuyaneseHaitianHmongHonduranHopiHoumaHungarianIcelanderIndian (Asian)IndonesianInupiatIranianIraqiIrishIroquoisIsraeliItalianJamaicanJapaneseJordanianKenyanKiowaKoreanLaotianLatvianLebaneseLiberianLithuanianLumbeeLuxembourgerMacedonianMalaysianMalteseMarshalleseMenomineeMexicanMexican American IndianMongolianMoroccanNative HawaiianNavajoNepaleseNew ZealanderNicaraguanNigerianNorthern EuropeanNorwegianOkinawanOsageOttawaPaiutePakistaniPalestinianPanamanianParaguayanPennsylvania GermanPeruvianPimaPolishPortuguesePotawatomiPuebloPuerto RicanPuget Sound SalishRomanianRussianSalvadoranSamoanScandinavianScotch-IrishScottishSeminoleSenegaleseSerbianShoshoneSierra LeoneanSiouxSlavicSlovakSloveneSomaliSouth AfricanSouth AmericanSouth American IndianSoviet UnionSpaniardSpanishSpanish AmericanSpanish American IndianSri LankanSubsaharan AfricanSudaneseSwedishSwissSyrianTaiwaneseThaiTlingit-HaidaTohono O'OdhamTonganTrinidadian and TobagonianTsimshianTurkishU.S. Virgin IslanderUgandanUkrainianUruguayanUteVenezuelanVietnameseWelshWest IndianYakamaYaquiYugoslavianYumanYup'ikZimbabwean
Immigration
NonimmigrantsImmigrantsAfghanistanAfricaAlbaniaArgentinaArmeniaAsiaAustraliaAustriaBahamasBangladeshBarbadosBelarusBelgiumBelizeBoliviaBosnia and HerzegovinaBrazilBulgariaBurma/MyanmarCabo VerdeCambodiaCameroonCanadaCaribbeanCentral AmericaChileChinaColombiaCongoCosta RicaCroatiaCubaCzechoslovakiaDenmarkDominicaDominican RepublicEastern AfricaEastern AsiaEastern EuropeEcuadorEgyptEl SalvadorEnglandEritreaEthiopiaEuropeFijiFranceGermanyGhanaGreeceGrenadaGuatemalaGuyanaHaitiHondurasHong KongHungaryIndiaIndonesiaIranIraqIrelandIsraelItalyJamaicaJapanJordanKazakhstanKenyaKoreaKuwaitLaosLatin AmericaLatviaLebanonLiberiaLithuaniaMalaysiaMexicoMicronesiaMiddle AfricaMoldovaMoroccoNepalNetherlandsNicaraguaNigeriaNorth AmericaNorth MacedoniaNorthern AfricaNorthern EuropeNorwayOceaniaPakistanPanamaPeruPhilippinesPolandPortugalRomaniaRussiaSaudi ArabiaScotlandSenegalSerbiaSierra LeoneSingaporeSomaliaSouth AfricaSouth AmericaSouth Central AsiaSouth Eastern AsiaSouthern EuropeSpainSri LankaSt. Vincent and the GrenadinesSudanSwedenSwitzerlandSyriaTaiwanThailandTrinidad and TobagoTurkeyUgandaUkraineUruguayUzbekistanVenezuelaVietnamWest IndiesWestern AfricaWestern AsiaWestern EuropeYemenZaireZimbabweAzores
Czechoslovakian
Race
Ancestry
AfghanAfricanAlaska NativeAlaskan AthabascanAlbanianAleutAlsatianAmericanApacheArabArapahoArgentineanArmenianAssyrian/Chaldean/SyriacAustralianAustrianBahamianBangladeshiBarbadianBasqueBelgianBelizeanBermudanBhutaneseBlackfeetBolivianBrazilianBritishBritish West IndianBulgarianBurmeseCajunCambodianCanadianCape VerdeanCarpatho RusynCelticCentral AmericanCentral American IndianCherokeeCheyenneChickasawChileanChineseChippewaChoctawColombianColvilleComancheCosta RicanCreeCreekCroatianCrowCubanCypriotCzechCzechoslovakianDanishDelawareDominicanDutchDutch West IndianEastern EuropeanEcuadorianEgyptianEnglishEstonianEthiopianEuropeanFijianFilipinoFinnishFrenchFrench American IndianFrench CanadianGermanGerman RussianGhanaianGreekGuamanian/ChamorroGuatemalanGuyaneseHaitianHmongHonduranHopiHoumaHungarianIcelanderIndian (Asian)IndonesianInupiatIranianIraqiIrishIroquoisIsraeliItalianJamaicanJapaneseJordanianKenyanKiowaKoreanLaotianLatvianLebaneseLiberianLithuanianLumbeeLuxembourgerMacedonianMalaysianMalteseMarshalleseMenomineeMexicanMexican American IndianMongolianMoroccanNative HawaiianNavajoNepaleseNew ZealanderNicaraguanNigerianNorthern EuropeanNorwegianOkinawanOsageOttawaPaiutePakistaniPalestinianPanamanianParaguayanPennsylvania GermanPeruvianPimaPolishPortuguesePotawatomiPuebloPuerto RicanPuget Sound SalishRomanianRussianSalvadoranSamoanScandinavianScotch-IrishScottishSeminoleSenegaleseSerbianShoshoneSierra LeoneanSiouxSlavicSlovakSloveneSomaliSouth AfricanSouth AmericanSouth American IndianSoviet UnionSpaniardSpanishSpanish AmericanSpanish American IndianSri LankanSubsaharan AfricanSudaneseSwedishSwissSyrianTaiwaneseThaiTlingit-HaidaTohono O'OdhamTonganTrinidadian and TobagonianTsimshianTurkishU.S. Virgin IslanderUgandanUkrainianUruguayanUteVenezuelanVietnameseWelshWest IndianYakamaYaquiYugoslavianYumanYup'ikZimbabwean
Immigration
NonimmigrantsImmigrantsAfghanistanAfricaAlbaniaArgentinaArmeniaAsiaAustraliaAustriaBahamasBangladeshBarbadosBelarusBelgiumBelizeBoliviaBosnia and HerzegovinaBulgariaBurma/MyanmarCabo VerdeCambodiaCameroonCanadaCaribbeanCentral AmericaChileChinaColombiaCongoCosta RicaCroatiaCubaCzechoslovakiaDenmarkDominicaDominican RepublicEastern AfricaEastern AsiaEastern EuropeEcuadorEgyptEl SalvadorEnglandEritreaEthiopiaEuropeFijiFranceGermanyGhanaGreeceGrenadaGuatemalaGuyanaHaitiHondurasHong KongHungaryIndiaIndonesiaIranIraqIrelandIsraelItalyJamaicaJapanJordanKazakhstanKenyaKoreaKuwaitLaosLatin AmericaLatviaLebanonLiberiaLithuaniaMalaysiaMexicoMicronesiaMiddle AfricaMoldovaMoroccoNepalNetherlandsNicaraguaNigeriaNorth AmericaNorth MacedoniaNorthern AfricaNorthern EuropeNorwayOceaniaPakistanPanamaPeruPhilippinesPolandPortugalRomaniaRussiaSaudi ArabiaScotlandSenegalSerbiaSierra LeoneSingaporeSomaliaSouth AfricaSouth AmericaSouth Central AsiaSouth Eastern AsiaSouthern EuropeSpainSri LankaSt. Vincent and the GrenadinesSudanSwedenSwitzerlandSyriaTaiwanThailandTrinidad and TobagoTurkeyUgandaUkraineUruguayUzbekistanVenezuelaVietnamWest IndiesWestern AfricaWestern AsiaWestern EuropeYemenZaireZimbabweAzores
Unemployment
Income
Poverty
Unemployment
Labor Participation
Family Structure
Vehicle Availability
Education Level
Disability

Unemployment Comparison

Immigrants from Brazil

Czechoslovakians

Good
Exceptional
5.2%
UNEMPLOYMENT
63.1/ 100
METRIC RATING
165th/ 347
METRIC RANK
4.8%
UNEMPLOYMENT
99.7/ 100
METRIC RATING
37th/ 347
METRIC RANK

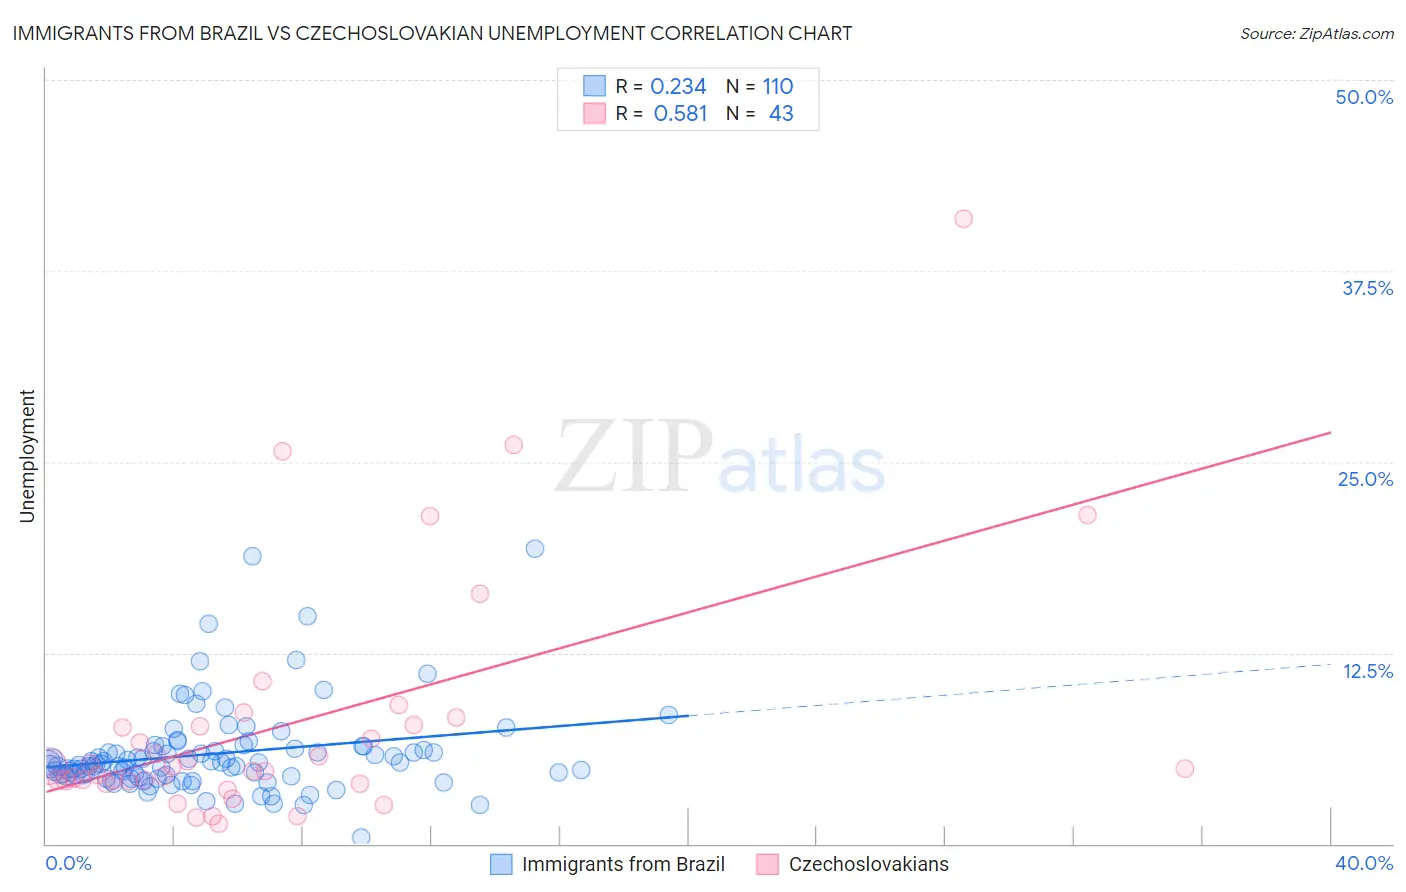
Immigrants from Brazil vs Czechoslovakian Unemployment Correlation Chart

The statistical analysis conducted on geographies consisting of 342,796,240 people shows a weak positive correlation between the proportion of Immigrants from Brazil and unemployment in the United States with a correlation coefficient (R) of 0.234 and weighted average of 5.2%. Similarly, the statistical analysis conducted on geographies consisting of 368,083,136 people shows a substantial positive correlation between the proportion of Czechoslovakians and unemployment in the United States with a correlation coefficient (R) of 0.581 and weighted average of 4.8%, a difference of 9.1%.
Immigrants from Brazil vs Czechoslovakian Unemployment

Unemployment Correlation Summary

MeasurementImmigrants from BrazilCzechoslovakian
Minimum0.40%1.3%
Maximum19.3%40.9%
Range18.9%39.6%
Mean5.9%7.8%
Median5.2%4.9%
Interquartile 25% (IQ1)4.5%4.1%
Interquartile 75% (IQ3)6.2%7.8%
Interquartile Range (IQR)1.7%3.7%
Standard Deviation (Sample)2.9%8.0%
Standard Deviation (Population)2.9%7.9%

Similar Demographics by Unemployment

Demographics Similar to Immigrants from Brazil by Unemployment

In terms of unemployment, the demographic groups most similar to Immigrants from Brazil are Immigrants from Zaire (5.2%, a difference of 0.11%), Immigrants from Colombia (5.2%, a difference of 0.11%), Spanish (5.2%, a difference of 0.13%), Immigrants from Indonesia (5.2%, a difference of 0.13%), and Colombian (5.2%, a difference of 0.13%).
DemographicsRating | RankUnemployment
Immigrants | Egypt
66.7
/100
|
#158
Good
5.2%
Immigrants | Russia
66.6
/100
|
#159
Good
5.2%
Laotians
66.3
/100
|
#160
Good
5.2%
Immigrants | Oceania
65.2
/100
|
#161
Good
5.2%
Spanish
65.1
/100
|
#162
Good
5.2%
Immigrants | Zaire
64.7
/100
|
#163
Good
5.2%
Immigrants | Colombia
64.7
/100
|
#164
Good
5.2%
Immigrants | Brazil
63.1
/100
|
#165
Good
5.2%
Immigrants | Indonesia
61.2
/100
|
#166
Good
5.2%
Colombians
61.1
/100
|
#167
Good
5.2%
Uruguayans
60.2
/100
|
#168
Good
5.2%
Immigrants | Morocco
59.1
/100
|
#169
Average
5.2%
Immigrants | Nicaragua
57.1
/100
|
#170
Average
5.2%
Puget Sound Salish
56.6
/100
|
#171
Average
5.2%
Immigrants | Vietnam
52.5
/100
|
#172
Average
5.2%

Demographics Similar to Czechoslovakians by Unemployment

In terms of unemployment, the demographic groups most similar to Czechoslovakians are Tongan (4.8%, a difference of 0.070%), Bolivian (4.8%, a difference of 0.19%), Scotch-Irish (4.8%, a difference of 0.29%), Lithuanian (4.8%, a difference of 0.34%), and Northern European (4.8%, a difference of 0.35%).
DemographicsRating | RankUnemployment
Irish
99.8
/100
|
#30
Exceptional
4.8%
Croatians
99.8
/100
|
#31
Exceptional
4.8%
Zimbabweans
99.8
/100
|
#32
Exceptional
4.8%
Sudanese
99.8
/100
|
#33
Exceptional
4.8%
Immigrants | Bolivia
99.8
/100
|
#34
Exceptional
4.8%
Scotch-Irish
99.8
/100
|
#35
Exceptional
4.8%
Tongans
99.7
/100
|
#36
Exceptional
4.8%
Czechoslovakians
99.7
/100
|
#37
Exceptional
4.8%
Bolivians
99.7
/100
|
#38
Exceptional
4.8%
Lithuanians
99.7
/100
|
#39
Exceptional
4.8%
Northern Europeans
99.7
/100
|
#40
Exceptional
4.8%
Immigrants | Bosnia and Herzegovina
99.7
/100
|
#41
Exceptional
4.8%
Filipinos
99.5
/100
|
#42
Exceptional
4.8%
Yugoslavians
99.5
/100
|
#43
Exceptional
4.8%
Austrians
99.5
/100
|
#44
Exceptional
4.8%