Liberian vs Czechoslovakian Unemployment
COMPARE
Liberian
Czechoslovakian
Unemployment
Unemployment Comparison
Liberians
Czechoslovakians
5.6%
UNEMPLOYMENT
0.9/ 100
METRIC RATING
248th/ 347
METRIC RANK
4.8%
UNEMPLOYMENT
99.7/ 100
METRIC RATING
37th/ 347
METRIC RANK
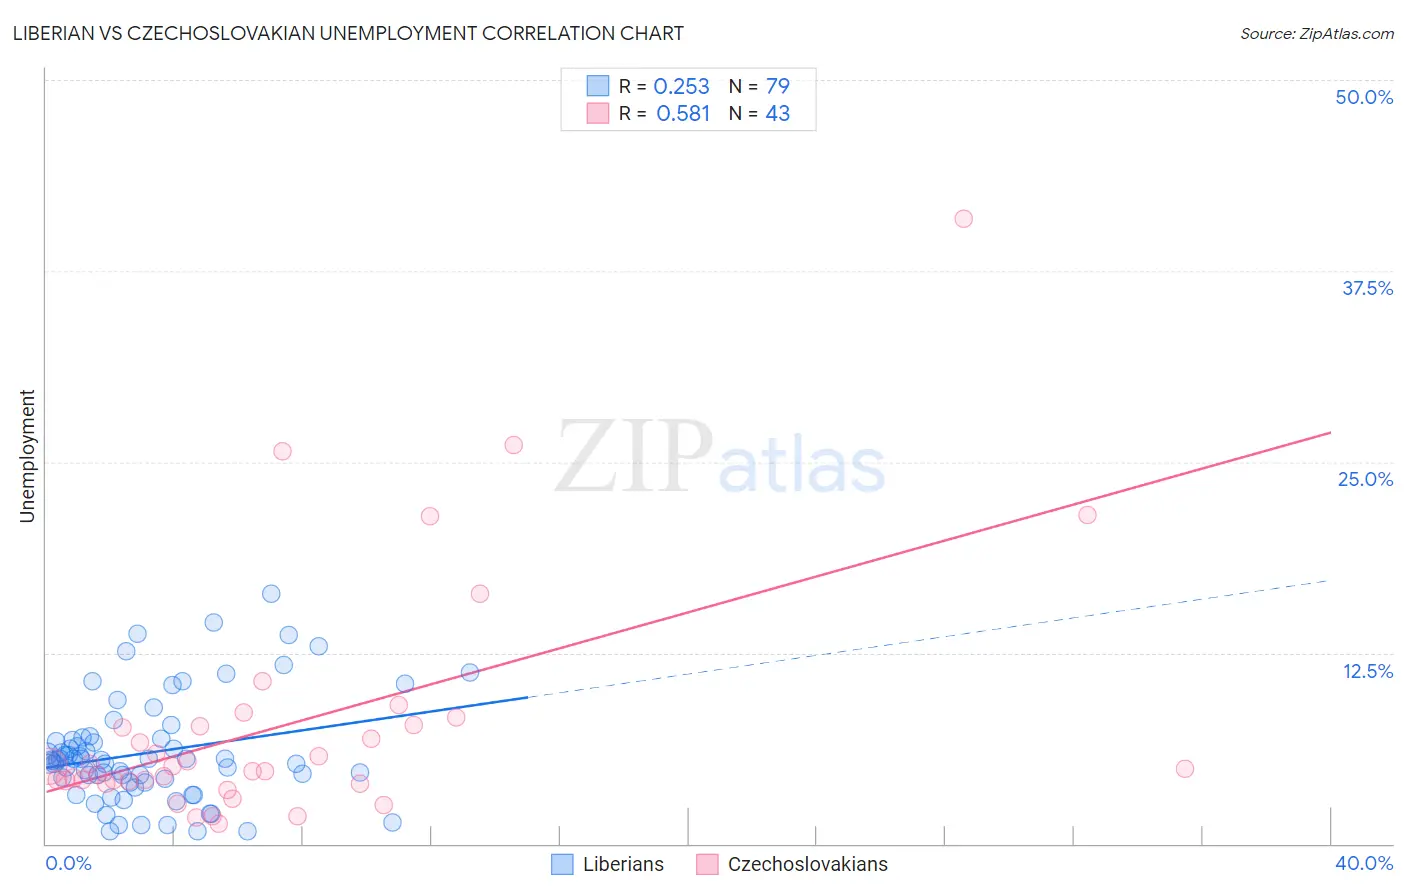
Liberian vs Czechoslovakian Unemployment Correlation Chart
The statistical analysis conducted on geographies consisting of 118,076,237 people shows a weak positive correlation between the proportion of Liberians and unemployment in the United States with a correlation coefficient (R) of 0.253 and weighted average of 5.6%. Similarly, the statistical analysis conducted on geographies consisting of 368,083,136 people shows a substantial positive correlation between the proportion of Czechoslovakians and unemployment in the United States with a correlation coefficient (R) of 0.581 and weighted average of 4.8%, a difference of 17.8%.
Unemployment Correlation Summary
| Measurement | Liberian | Czechoslovakian |
| Minimum | 0.80% | 1.3% |
| Maximum | 16.4% | 40.9% |
| Range | 15.6% | 39.6% |
| Mean | 6.0% | 7.8% |
| Median | 5.5% | 4.9% |
| Interquartile 25% (IQ1) | 4.0% | 4.1% |
| Interquartile 75% (IQ3) | 6.9% | 7.8% |
| Interquartile Range (IQR) | 2.9% | 3.7% |
| Standard Deviation (Sample) | 3.4% | 8.0% |
| Standard Deviation (Population) | 3.4% | 7.9% |
Similar Demographics by Unemployment
Demographics Similar to Liberians by Unemployment
In terms of unemployment, the demographic groups most similar to Liberians are Immigrants from Cameroon (5.6%, a difference of 0.13%), Cajun (5.6%, a difference of 0.26%), Japanese (5.6%, a difference of 0.27%), Bermudan (5.6%, a difference of 0.28%), and French American Indian (5.6%, a difference of 0.32%).
| Demographics | Rating | Rank | Unemployment |
| Tlingit-Haida | 2.0 /100 | #241 | Tragic 5.6% |
| Spanish Americans | 2.0 /100 | #242 | Tragic 5.6% |
| Marshallese | 1.3 /100 | #243 | Tragic 5.6% |
| Dutch West Indians | 1.2 /100 | #244 | Tragic 5.6% |
| French American Indians | 1.2 /100 | #245 | Tragic 5.6% |
| Bermudans | 1.1 /100 | #246 | Tragic 5.6% |
| Immigrants | Cameroon | 1.0 /100 | #247 | Tragic 5.6% |
| Liberians | 0.9 /100 | #248 | Tragic 5.6% |
| Cajuns | 0.8 /100 | #249 | Tragic 5.6% |
| Japanese | 0.8 /100 | #250 | Tragic 5.6% |
| Kiowa | 0.6 /100 | #251 | Tragic 5.7% |
| Hondurans | 0.3 /100 | #252 | Tragic 5.7% |
| Central Americans | 0.3 /100 | #253 | Tragic 5.7% |
| Immigrants | Honduras | 0.3 /100 | #254 | Tragic 5.7% |
| Immigrants | Portugal | 0.2 /100 | #255 | Tragic 5.7% |
Demographics Similar to Czechoslovakians by Unemployment
In terms of unemployment, the demographic groups most similar to Czechoslovakians are Tongan (4.8%, a difference of 0.070%), Bolivian (4.8%, a difference of 0.19%), Scotch-Irish (4.8%, a difference of 0.29%), Lithuanian (4.8%, a difference of 0.34%), and Northern European (4.8%, a difference of 0.35%).
| Demographics | Rating | Rank | Unemployment |
| Irish | 99.8 /100 | #30 | Exceptional 4.8% |
| Croatians | 99.8 /100 | #31 | Exceptional 4.8% |
| Zimbabweans | 99.8 /100 | #32 | Exceptional 4.8% |
| Sudanese | 99.8 /100 | #33 | Exceptional 4.8% |
| Immigrants | Bolivia | 99.8 /100 | #34 | Exceptional 4.8% |
| Scotch-Irish | 99.8 /100 | #35 | Exceptional 4.8% |
| Tongans | 99.7 /100 | #36 | Exceptional 4.8% |
| Czechoslovakians | 99.7 /100 | #37 | Exceptional 4.8% |
| Bolivians | 99.7 /100 | #38 | Exceptional 4.8% |
| Lithuanians | 99.7 /100 | #39 | Exceptional 4.8% |
| Northern Europeans | 99.7 /100 | #40 | Exceptional 4.8% |
| Immigrants | Bosnia and Herzegovina | 99.7 /100 | #41 | Exceptional 4.8% |
| Filipinos | 99.5 /100 | #42 | Exceptional 4.8% |
| Yugoslavians | 99.5 /100 | #43 | Exceptional 4.8% |
| Austrians | 99.5 /100 | #44 | Exceptional 4.8% |