Barbadian vs Immigrants from Japan Unemployment
COMPARE
Barbadian
Immigrants from Japan
Unemployment
Unemployment Comparison
Barbadians
Immigrants from Japan
6.5%
UNEMPLOYMENT
0.0/ 100
METRIC RATING
308th/ 347
METRIC RANK
4.9%
UNEMPLOYMENT
98.3/ 100
METRIC RATING
71st/ 347
METRIC RANK
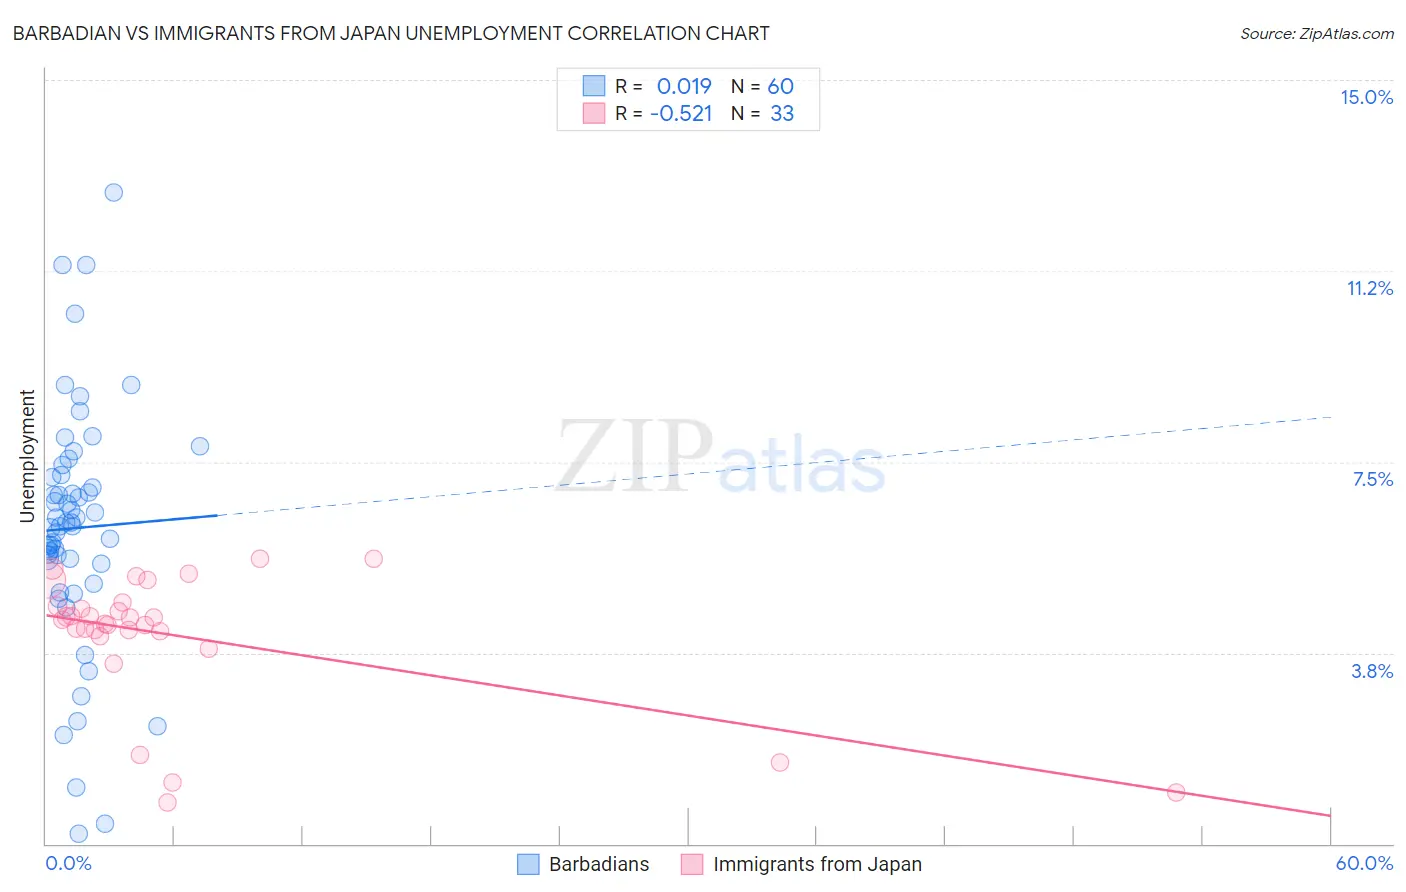
Barbadian vs Immigrants from Japan Unemployment Correlation Chart
The statistical analysis conducted on geographies consisting of 141,269,105 people shows no correlation between the proportion of Barbadians and unemployment in the United States with a correlation coefficient (R) of 0.019 and weighted average of 6.5%. Similarly, the statistical analysis conducted on geographies consisting of 339,966,426 people shows a substantial negative correlation between the proportion of Immigrants from Japan and unemployment in the United States with a correlation coefficient (R) of -0.521 and weighted average of 4.9%, a difference of 31.8%.
Unemployment Correlation Summary
| Measurement | Barbadian | Immigrants from Japan |
| Minimum | 0.20% | 0.80% |
| Maximum | 12.8% | 5.6% |
| Range | 12.6% | 4.8% |
| Mean | 6.2% | 4.1% |
| Median | 6.3% | 4.4% |
| Interquartile 25% (IQ1) | 5.6% | 4.1% |
| Interquartile 75% (IQ3) | 7.2% | 4.7% |
| Interquartile Range (IQR) | 1.7% | 0.58% |
| Standard Deviation (Sample) | 2.4% | 1.3% |
| Standard Deviation (Population) | 2.4% | 1.3% |
Similar Demographics by Unemployment
Demographics Similar to Barbadians by Unemployment
In terms of unemployment, the demographic groups most similar to Barbadians are Vietnamese (6.5%, a difference of 0.010%), Immigrants from Belize (6.5%, a difference of 0.28%), Immigrants from Bangladesh (6.5%, a difference of 0.37%), Cape Verdean (6.5%, a difference of 0.61%), and Lumbee (6.4%, a difference of 0.86%).
| Demographics | Rating | Rank | Unemployment |
| Trinidadians and Tobagonians | 0.0 /100 | #301 | Tragic 6.3% |
| West Indians | 0.0 /100 | #302 | Tragic 6.4% |
| Belizeans | 0.0 /100 | #303 | Tragic 6.4% |
| Immigrants | Jamaica | 0.0 /100 | #304 | Tragic 6.4% |
| Menominee | 0.0 /100 | #305 | Tragic 6.4% |
| Lumbee | 0.0 /100 | #306 | Tragic 6.4% |
| Immigrants | Bangladesh | 0.0 /100 | #307 | Tragic 6.5% |
| Barbadians | 0.0 /100 | #308 | Tragic 6.5% |
| Vietnamese | 0.0 /100 | #309 | Tragic 6.5% |
| Immigrants | Belize | 0.0 /100 | #310 | Tragic 6.5% |
| Cape Verdeans | 0.0 /100 | #311 | Tragic 6.5% |
| Colville | 0.0 /100 | #312 | Tragic 6.6% |
| Immigrants | Barbados | 0.0 /100 | #313 | Tragic 6.6% |
| Blacks/African Americans | 0.0 /100 | #314 | Tragic 6.6% |
| Houma | 0.0 /100 | #315 | Tragic 6.7% |
Demographics Similar to Immigrants from Japan by Unemployment
In terms of unemployment, the demographic groups most similar to Immigrants from Japan are Burmese (4.9%, a difference of 0.020%), Serbian (4.9%, a difference of 0.050%), Paraguayan (4.9%, a difference of 0.070%), Immigrants from Northern Europe (4.9%, a difference of 0.16%), and Immigrants from North America (4.9%, a difference of 0.21%).
| Demographics | Rating | Rank | Unemployment |
| Italians | 98.9 /100 | #64 | Exceptional 4.9% |
| Immigrants | Canada | 98.8 /100 | #65 | Exceptional 4.9% |
| Slovaks | 98.7 /100 | #66 | Exceptional 4.9% |
| New Zealanders | 98.6 /100 | #67 | Exceptional 4.9% |
| Slavs | 98.6 /100 | #68 | Exceptional 4.9% |
| Immigrants | North America | 98.5 /100 | #69 | Exceptional 4.9% |
| Serbians | 98.4 /100 | #70 | Exceptional 4.9% |
| Immigrants | Japan | 98.3 /100 | #71 | Exceptional 4.9% |
| Burmese | 98.3 /100 | #72 | Exceptional 4.9% |
| Paraguayans | 98.3 /100 | #73 | Exceptional 4.9% |
| Immigrants | Northern Europe | 98.2 /100 | #74 | Exceptional 4.9% |
| Turks | 98.0 /100 | #75 | Exceptional 4.9% |
| German Russians | 98.0 /100 | #76 | Exceptional 4.9% |
| Cypriots | 97.9 /100 | #77 | Exceptional 4.9% |
| Okinawans | 97.9 /100 | #78 | Exceptional 4.9% |