Barbadian vs Filipino Unemployment
COMPARE
Barbadian
Filipino
Unemployment
Unemployment Comparison
Barbadians
Filipinos
6.5%
UNEMPLOYMENT
0.0/ 100
METRIC RATING
308th/ 347
METRIC RANK
4.8%
UNEMPLOYMENT
99.5/ 100
METRIC RATING
42nd/ 347
METRIC RANK
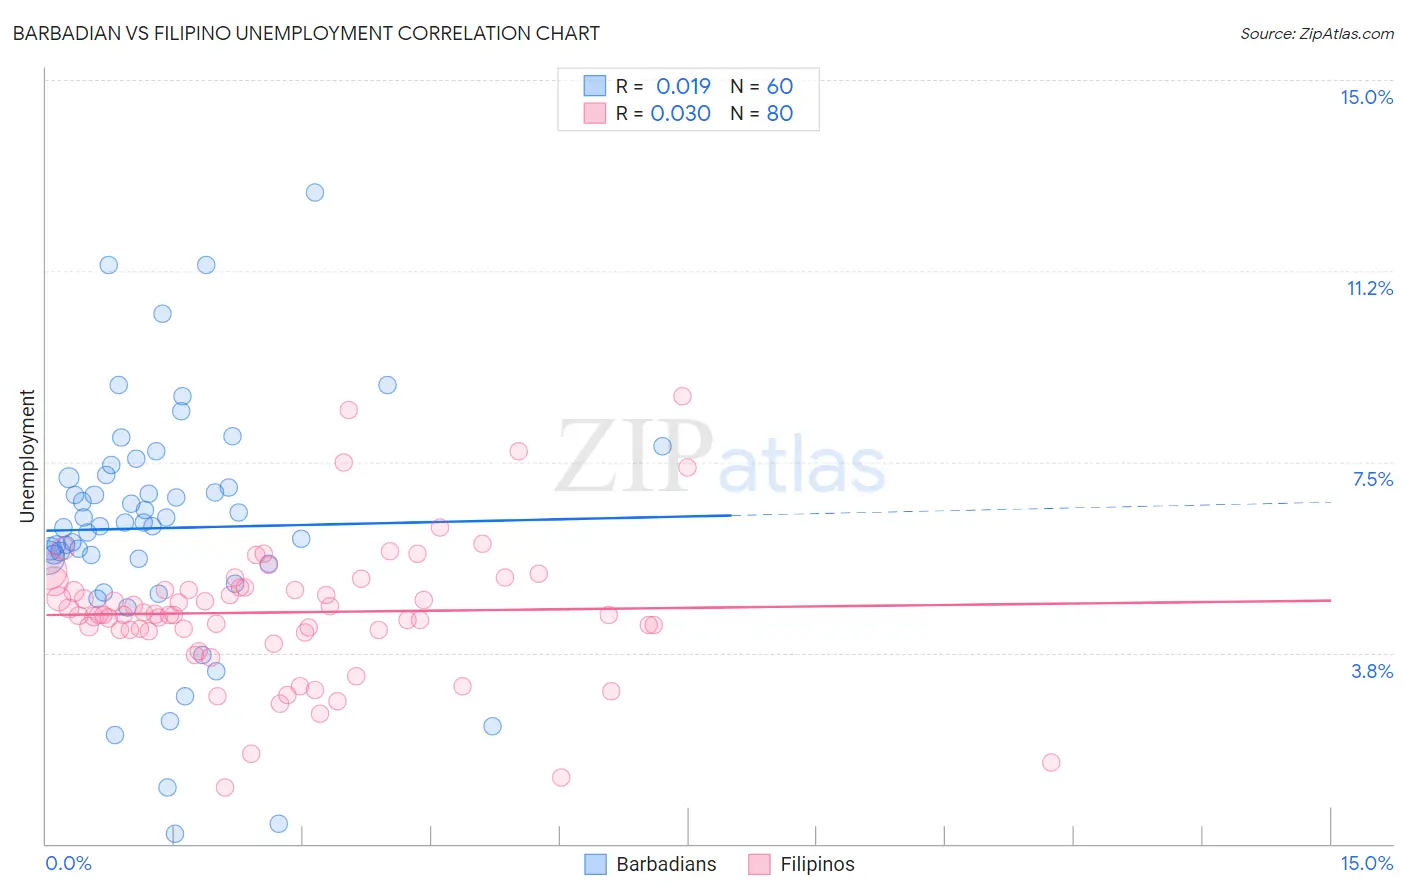
Barbadian vs Filipino Unemployment Correlation Chart
The statistical analysis conducted on geographies consisting of 141,269,105 people shows no correlation between the proportion of Barbadians and unemployment in the United States with a correlation coefficient (R) of 0.019 and weighted average of 6.5%. Similarly, the statistical analysis conducted on geographies consisting of 254,275,542 people shows no correlation between the proportion of Filipinos and unemployment in the United States with a correlation coefficient (R) of 0.030 and weighted average of 4.8%, a difference of 34.7%.
Unemployment Correlation Summary
| Measurement | Barbadian | Filipino |
| Minimum | 0.20% | 1.1% |
| Maximum | 12.8% | 8.8% |
| Range | 12.6% | 7.7% |
| Mean | 6.2% | 4.5% |
| Median | 6.3% | 4.5% |
| Interquartile 25% (IQ1) | 5.6% | 4.2% |
| Interquartile 75% (IQ3) | 7.2% | 5.0% |
| Interquartile Range (IQR) | 1.7% | 0.84% |
| Standard Deviation (Sample) | 2.4% | 1.4% |
| Standard Deviation (Population) | 2.4% | 1.4% |
Similar Demographics by Unemployment
Demographics Similar to Barbadians by Unemployment
In terms of unemployment, the demographic groups most similar to Barbadians are Vietnamese (6.5%, a difference of 0.010%), Immigrants from Belize (6.5%, a difference of 0.28%), Immigrants from Bangladesh (6.5%, a difference of 0.37%), Cape Verdean (6.5%, a difference of 0.61%), and Lumbee (6.4%, a difference of 0.86%).
| Demographics | Rating | Rank | Unemployment |
| Trinidadians and Tobagonians | 0.0 /100 | #301 | Tragic 6.3% |
| West Indians | 0.0 /100 | #302 | Tragic 6.4% |
| Belizeans | 0.0 /100 | #303 | Tragic 6.4% |
| Immigrants | Jamaica | 0.0 /100 | #304 | Tragic 6.4% |
| Menominee | 0.0 /100 | #305 | Tragic 6.4% |
| Lumbee | 0.0 /100 | #306 | Tragic 6.4% |
| Immigrants | Bangladesh | 0.0 /100 | #307 | Tragic 6.5% |
| Barbadians | 0.0 /100 | #308 | Tragic 6.5% |
| Vietnamese | 0.0 /100 | #309 | Tragic 6.5% |
| Immigrants | Belize | 0.0 /100 | #310 | Tragic 6.5% |
| Cape Verdeans | 0.0 /100 | #311 | Tragic 6.5% |
| Colville | 0.0 /100 | #312 | Tragic 6.6% |
| Immigrants | Barbados | 0.0 /100 | #313 | Tragic 6.6% |
| Blacks/African Americans | 0.0 /100 | #314 | Tragic 6.6% |
| Houma | 0.0 /100 | #315 | Tragic 6.7% |
Demographics Similar to Filipinos by Unemployment
In terms of unemployment, the demographic groups most similar to Filipinos are Yugoslavian (4.8%, a difference of 0.20%), Austrian (4.8%, a difference of 0.26%), French (4.8%, a difference of 0.31%), Immigrants from Bosnia and Herzegovina (4.8%, a difference of 0.48%), and Immigrants from Nepal (4.8%, a difference of 0.48%).
| Demographics | Rating | Rank | Unemployment |
| Scotch-Irish | 99.8 /100 | #35 | Exceptional 4.8% |
| Tongans | 99.7 /100 | #36 | Exceptional 4.8% |
| Czechoslovakians | 99.7 /100 | #37 | Exceptional 4.8% |
| Bolivians | 99.7 /100 | #38 | Exceptional 4.8% |
| Lithuanians | 99.7 /100 | #39 | Exceptional 4.8% |
| Northern Europeans | 99.7 /100 | #40 | Exceptional 4.8% |
| Immigrants | Bosnia and Herzegovina | 99.7 /100 | #41 | Exceptional 4.8% |
| Filipinos | 99.5 /100 | #42 | Exceptional 4.8% |
| Yugoslavians | 99.5 /100 | #43 | Exceptional 4.8% |
| Austrians | 99.5 /100 | #44 | Exceptional 4.8% |
| French | 99.5 /100 | #45 | Exceptional 4.8% |
| Immigrants | Nepal | 99.4 /100 | #46 | Exceptional 4.8% |
| Immigrants | Taiwan | 99.4 /100 | #47 | Exceptional 4.8% |
| Immigrants | Scotland | 99.3 /100 | #48 | Exceptional 4.9% |
| Immigrants | South Central Asia | 99.3 /100 | #49 | Exceptional 4.9% |