Bulgarian vs Czechoslovakian Unemployment
COMPARE
Bulgarian
Czechoslovakian
Unemployment
Unemployment Comparison
Bulgarians
Czechoslovakians
4.7%
UNEMPLOYMENT
99.9/ 100
METRIC RATING
26th/ 347
METRIC RANK
4.8%
UNEMPLOYMENT
99.7/ 100
METRIC RATING
37th/ 347
METRIC RANK
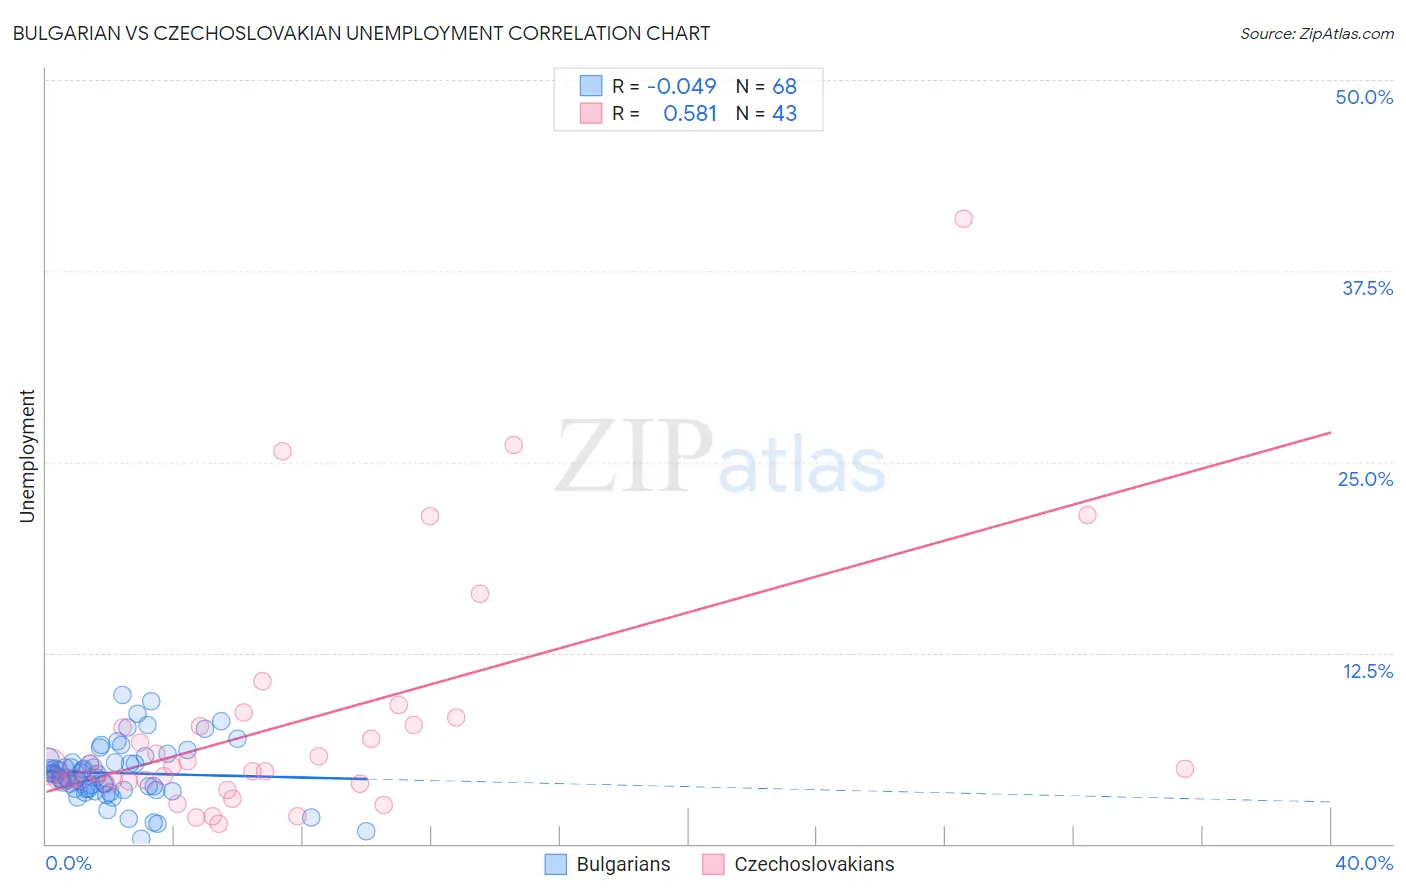
Bulgarian vs Czechoslovakian Unemployment Correlation Chart
The statistical analysis conducted on geographies consisting of 205,555,783 people shows no correlation between the proportion of Bulgarians and unemployment in the United States with a correlation coefficient (R) of -0.049 and weighted average of 4.7%. Similarly, the statistical analysis conducted on geographies consisting of 368,083,136 people shows a substantial positive correlation between the proportion of Czechoslovakians and unemployment in the United States with a correlation coefficient (R) of 0.581 and weighted average of 4.8%, a difference of 1.4%.
Unemployment Correlation Summary
| Measurement | Bulgarian | Czechoslovakian |
| Minimum | 0.30% | 1.3% |
| Maximum | 9.7% | 40.9% |
| Range | 9.4% | 39.6% |
| Mean | 4.6% | 7.8% |
| Median | 4.5% | 4.9% |
| Interquartile 25% (IQ1) | 3.6% | 4.1% |
| Interquartile 75% (IQ3) | 5.3% | 7.8% |
| Interquartile Range (IQR) | 1.7% | 3.7% |
| Standard Deviation (Sample) | 1.9% | 8.0% |
| Standard Deviation (Population) | 1.8% | 7.9% |
Demographics Similar to Bulgarians and Czechoslovakians by Unemployment
In terms of unemployment, the demographic groups most similar to Bulgarians are Latvian (4.7%, a difference of 0.040%), Venezuelan (4.7%, a difference of 0.11%), British (4.7%, a difference of 0.19%), Finnish (4.7%, a difference of 0.21%), and Welsh (4.7%, a difference of 0.49%). Similarly, the demographic groups most similar to Czechoslovakians are Tongan (4.8%, a difference of 0.070%), Bolivian (4.8%, a difference of 0.19%), Scotch-Irish (4.8%, a difference of 0.29%), Lithuanian (4.8%, a difference of 0.34%), and Northern European (4.8%, a difference of 0.35%).
| Demographics | Rating | Rank | Unemployment |
| Welsh | 99.9 /100 | #21 | Exceptional 4.7% |
| Thais | 99.9 /100 | #22 | Exceptional 4.7% |
| British | 99.9 /100 | #23 | Exceptional 4.7% |
| Venezuelans | 99.9 /100 | #24 | Exceptional 4.7% |
| Latvians | 99.9 /100 | #25 | Exceptional 4.7% |
| Bulgarians | 99.9 /100 | #26 | Exceptional 4.7% |
| Finns | 99.9 /100 | #27 | Exceptional 4.7% |
| Cubans | 99.8 /100 | #28 | Exceptional 4.7% |
| Poles | 99.8 /100 | #29 | Exceptional 4.7% |
| Irish | 99.8 /100 | #30 | Exceptional 4.8% |
| Croatians | 99.8 /100 | #31 | Exceptional 4.8% |
| Zimbabweans | 99.8 /100 | #32 | Exceptional 4.8% |
| Sudanese | 99.8 /100 | #33 | Exceptional 4.8% |
| Immigrants | Bolivia | 99.8 /100 | #34 | Exceptional 4.8% |
| Scotch-Irish | 99.8 /100 | #35 | Exceptional 4.8% |
| Tongans | 99.7 /100 | #36 | Exceptional 4.8% |
| Czechoslovakians | 99.7 /100 | #37 | Exceptional 4.8% |
| Bolivians | 99.7 /100 | #38 | Exceptional 4.8% |
| Lithuanians | 99.7 /100 | #39 | Exceptional 4.8% |
| Northern Europeans | 99.7 /100 | #40 | Exceptional 4.8% |
| Immigrants | Bosnia and Herzegovina | 99.7 /100 | #41 | Exceptional 4.8% |