Barbadian vs Immigrants from Cambodia Unemployment
COMPARE
Barbadian
Immigrants from Cambodia
Unemployment
Unemployment Comparison
Barbadians
Immigrants from Cambodia
6.5%
UNEMPLOYMENT
0.0/ 100
METRIC RATING
308th/ 347
METRIC RANK
5.5%
UNEMPLOYMENT
3.3/ 100
METRIC RATING
236th/ 347
METRIC RANK
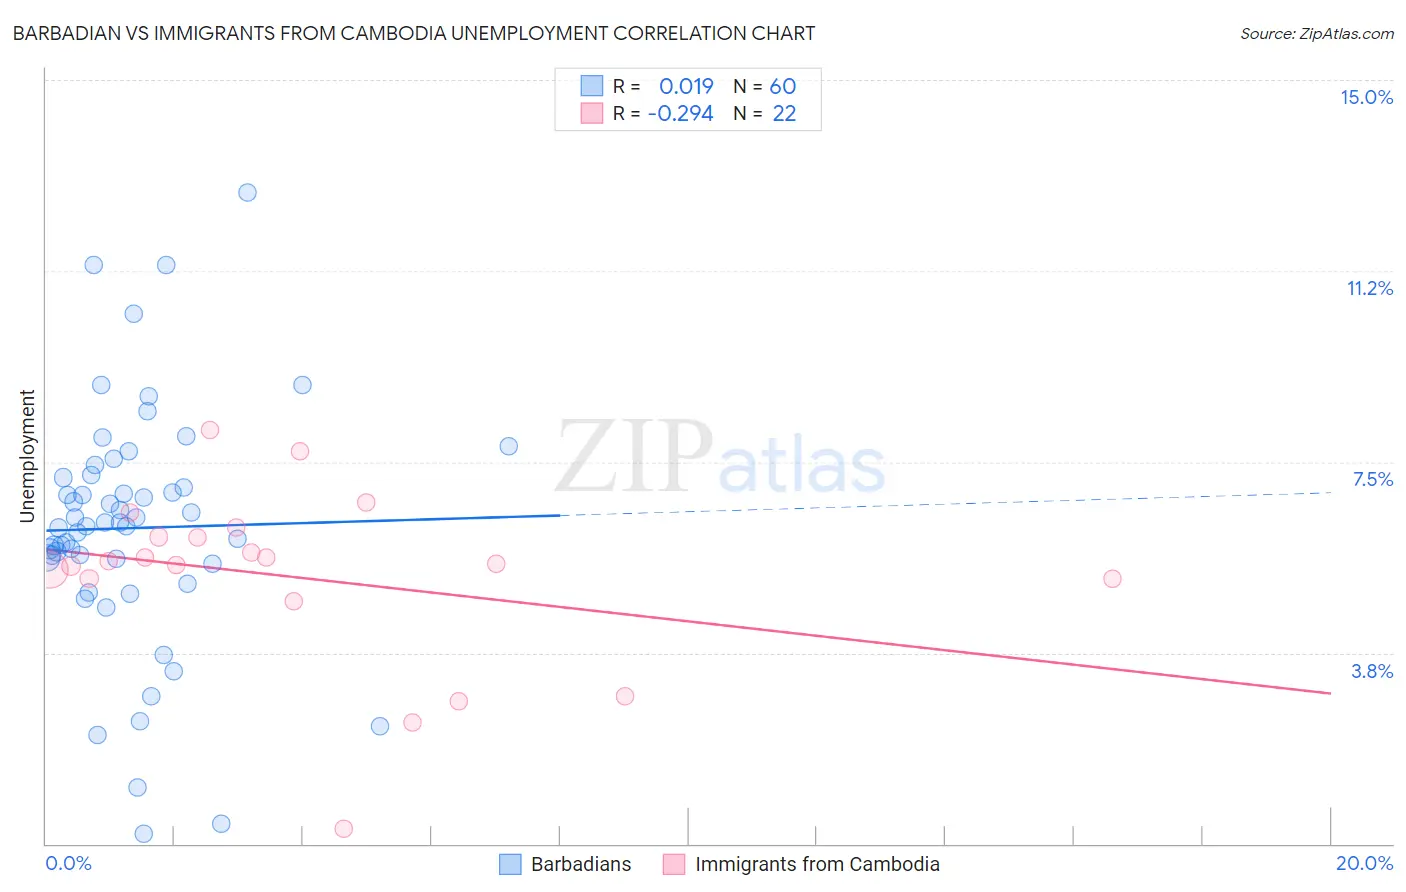
Barbadian vs Immigrants from Cambodia Unemployment Correlation Chart
The statistical analysis conducted on geographies consisting of 141,269,105 people shows no correlation between the proportion of Barbadians and unemployment in the United States with a correlation coefficient (R) of 0.019 and weighted average of 6.5%. Similarly, the statistical analysis conducted on geographies consisting of 205,100,731 people shows a weak negative correlation between the proportion of Immigrants from Cambodia and unemployment in the United States with a correlation coefficient (R) of -0.294 and weighted average of 5.5%, a difference of 17.4%.
Unemployment Correlation Summary
| Measurement | Barbadian | Immigrants from Cambodia |
| Minimum | 0.20% | 0.30% |
| Maximum | 12.8% | 8.1% |
| Range | 12.6% | 7.8% |
| Mean | 6.2% | 5.2% |
| Median | 6.3% | 5.5% |
| Interquartile 25% (IQ1) | 5.6% | 5.2% |
| Interquartile 75% (IQ3) | 7.2% | 6.0% |
| Interquartile Range (IQR) | 1.7% | 0.83% |
| Standard Deviation (Sample) | 2.4% | 1.8% |
| Standard Deviation (Population) | 2.4% | 1.7% |
Similar Demographics by Unemployment
Demographics Similar to Barbadians by Unemployment
In terms of unemployment, the demographic groups most similar to Barbadians are Vietnamese (6.5%, a difference of 0.010%), Immigrants from Belize (6.5%, a difference of 0.28%), Immigrants from Bangladesh (6.5%, a difference of 0.37%), Cape Verdean (6.5%, a difference of 0.61%), and Lumbee (6.4%, a difference of 0.86%).
| Demographics | Rating | Rank | Unemployment |
| Trinidadians and Tobagonians | 0.0 /100 | #301 | Tragic 6.3% |
| West Indians | 0.0 /100 | #302 | Tragic 6.4% |
| Belizeans | 0.0 /100 | #303 | Tragic 6.4% |
| Immigrants | Jamaica | 0.0 /100 | #304 | Tragic 6.4% |
| Menominee | 0.0 /100 | #305 | Tragic 6.4% |
| Lumbee | 0.0 /100 | #306 | Tragic 6.4% |
| Immigrants | Bangladesh | 0.0 /100 | #307 | Tragic 6.5% |
| Barbadians | 0.0 /100 | #308 | Tragic 6.5% |
| Vietnamese | 0.0 /100 | #309 | Tragic 6.5% |
| Immigrants | Belize | 0.0 /100 | #310 | Tragic 6.5% |
| Cape Verdeans | 0.0 /100 | #311 | Tragic 6.5% |
| Colville | 0.0 /100 | #312 | Tragic 6.6% |
| Immigrants | Barbados | 0.0 /100 | #313 | Tragic 6.6% |
| Blacks/African Americans | 0.0 /100 | #314 | Tragic 6.6% |
| Houma | 0.0 /100 | #315 | Tragic 6.7% |
Demographics Similar to Immigrants from Cambodia by Unemployment
In terms of unemployment, the demographic groups most similar to Immigrants from Cambodia are Immigrants from Panama (5.5%, a difference of 0.030%), Moroccan (5.5%, a difference of 0.060%), Immigrants from Western Asia (5.5%, a difference of 0.27%), Immigrants (5.5%, a difference of 0.36%), and Cree (5.6%, a difference of 0.37%).
| Demographics | Rating | Rank | Unemployment |
| Hawaiians | 5.4 /100 | #229 | Tragic 5.5% |
| Ottawa | 5.4 /100 | #230 | Tragic 5.5% |
| Immigrants | Africa | 4.9 /100 | #231 | Tragic 5.5% |
| Comanche | 4.9 /100 | #232 | Tragic 5.5% |
| Immigrants | Syria | 4.8 /100 | #233 | Tragic 5.5% |
| Panamanians | 4.7 /100 | #234 | Tragic 5.5% |
| Immigrants | Panama | 3.4 /100 | #235 | Tragic 5.5% |
| Immigrants | Cambodia | 3.3 /100 | #236 | Tragic 5.5% |
| Moroccans | 3.2 /100 | #237 | Tragic 5.5% |
| Immigrants | Western Asia | 2.8 /100 | #238 | Tragic 5.5% |
| Immigrants | Immigrants | 2.6 /100 | #239 | Tragic 5.5% |
| Cree | 2.6 /100 | #240 | Tragic 5.6% |
| Tlingit-Haida | 2.0 /100 | #241 | Tragic 5.6% |
| Spanish Americans | 2.0 /100 | #242 | Tragic 5.6% |
| Marshallese | 1.3 /100 | #243 | Tragic 5.6% |