Barbadian vs Native Hawaiian Unemployment
COMPARE
Barbadian
Native Hawaiian
Unemployment
Unemployment Comparison
Barbadians
Native Hawaiians
6.5%
UNEMPLOYMENT
0.0/ 100
METRIC RATING
308th/ 347
METRIC RANK
5.3%
UNEMPLOYMENT
24.1/ 100
METRIC RATING
205th/ 347
METRIC RANK
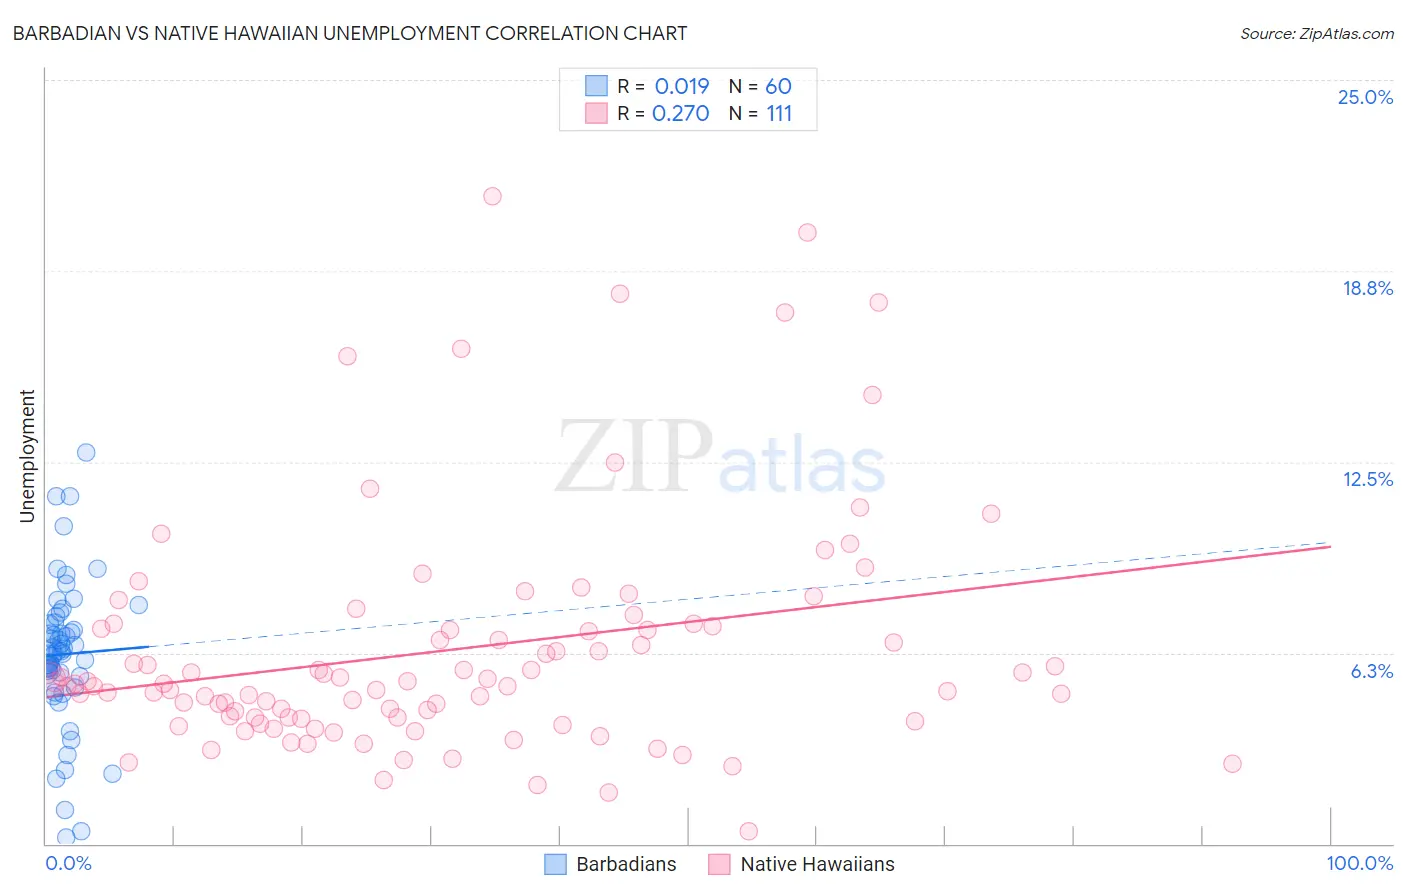
Barbadian vs Native Hawaiian Unemployment Correlation Chart
The statistical analysis conducted on geographies consisting of 141,269,105 people shows no correlation between the proportion of Barbadians and unemployment in the United States with a correlation coefficient (R) of 0.019 and weighted average of 6.5%. Similarly, the statistical analysis conducted on geographies consisting of 331,714,087 people shows a weak positive correlation between the proportion of Native Hawaiians and unemployment in the United States with a correlation coefficient (R) of 0.270 and weighted average of 5.3%, a difference of 21.4%.
Unemployment Correlation Summary
| Measurement | Barbadian | Native Hawaiian |
| Minimum | 0.20% | 0.40% |
| Maximum | 12.8% | 21.2% |
| Range | 12.6% | 20.8% |
| Mean | 6.2% | 6.3% |
| Median | 6.3% | 5.3% |
| Interquartile 25% (IQ1) | 5.6% | 4.1% |
| Interquartile 75% (IQ3) | 7.2% | 7.1% |
| Interquartile Range (IQR) | 1.7% | 3.0% |
| Standard Deviation (Sample) | 2.4% | 3.9% |
| Standard Deviation (Population) | 2.4% | 3.8% |
Similar Demographics by Unemployment
Demographics Similar to Barbadians by Unemployment
In terms of unemployment, the demographic groups most similar to Barbadians are Vietnamese (6.5%, a difference of 0.010%), Immigrants from Belize (6.5%, a difference of 0.28%), Immigrants from Bangladesh (6.5%, a difference of 0.37%), Cape Verdean (6.5%, a difference of 0.61%), and Lumbee (6.4%, a difference of 0.86%).
| Demographics | Rating | Rank | Unemployment |
| Trinidadians and Tobagonians | 0.0 /100 | #301 | Tragic 6.3% |
| West Indians | 0.0 /100 | #302 | Tragic 6.4% |
| Belizeans | 0.0 /100 | #303 | Tragic 6.4% |
| Immigrants | Jamaica | 0.0 /100 | #304 | Tragic 6.4% |
| Menominee | 0.0 /100 | #305 | Tragic 6.4% |
| Lumbee | 0.0 /100 | #306 | Tragic 6.4% |
| Immigrants | Bangladesh | 0.0 /100 | #307 | Tragic 6.5% |
| Barbadians | 0.0 /100 | #308 | Tragic 6.5% |
| Vietnamese | 0.0 /100 | #309 | Tragic 6.5% |
| Immigrants | Belize | 0.0 /100 | #310 | Tragic 6.5% |
| Cape Verdeans | 0.0 /100 | #311 | Tragic 6.5% |
| Colville | 0.0 /100 | #312 | Tragic 6.6% |
| Immigrants | Barbados | 0.0 /100 | #313 | Tragic 6.6% |
| Blacks/African Americans | 0.0 /100 | #314 | Tragic 6.6% |
| Houma | 0.0 /100 | #315 | Tragic 6.7% |
Demographics Similar to Native Hawaiians by Unemployment
In terms of unemployment, the demographic groups most similar to Native Hawaiians are Immigrants from Ukraine (5.3%, a difference of 0.060%), Immigrants from Micronesia (5.3%, a difference of 0.080%), Cherokee (5.3%, a difference of 0.11%), Immigrants from Peru (5.4%, a difference of 0.13%), and Immigrants from South Eastern Asia (5.3%, a difference of 0.23%).
| Demographics | Rating | Rank | Unemployment |
| Immigrants | Israel | 28.6 /100 | #198 | Fair 5.3% |
| Immigrants | Afghanistan | 28.6 /100 | #199 | Fair 5.3% |
| Koreans | 27.4 /100 | #200 | Fair 5.3% |
| Immigrants | South Eastern Asia | 27.0 /100 | #201 | Fair 5.3% |
| Cherokee | 25.5 /100 | #202 | Fair 5.3% |
| Immigrants | Micronesia | 25.2 /100 | #203 | Fair 5.3% |
| Immigrants | Ukraine | 24.9 /100 | #204 | Fair 5.3% |
| Native Hawaiians | 24.1 /100 | #205 | Fair 5.3% |
| Immigrants | Peru | 22.7 /100 | #206 | Fair 5.4% |
| Creek | 19.4 /100 | #207 | Poor 5.4% |
| Portuguese | 19.0 /100 | #208 | Poor 5.4% |
| Immigrants | Iran | 18.8 /100 | #209 | Poor 5.4% |
| Immigrants | Iraq | 18.6 /100 | #210 | Poor 5.4% |
| Iraqis | 18.1 /100 | #211 | Poor 5.4% |
| Ugandans | 18.0 /100 | #212 | Poor 5.4% |