Greek vs Czechoslovakian Unemployment
COMPARE
Greek
Czechoslovakian
Unemployment
Unemployment Comparison
Greeks
Czechoslovakians
4.9%
UNEMPLOYMENT
99.0/ 100
METRIC RATING
58th/ 347
METRIC RANK
4.8%
UNEMPLOYMENT
99.7/ 100
METRIC RATING
37th/ 347
METRIC RANK
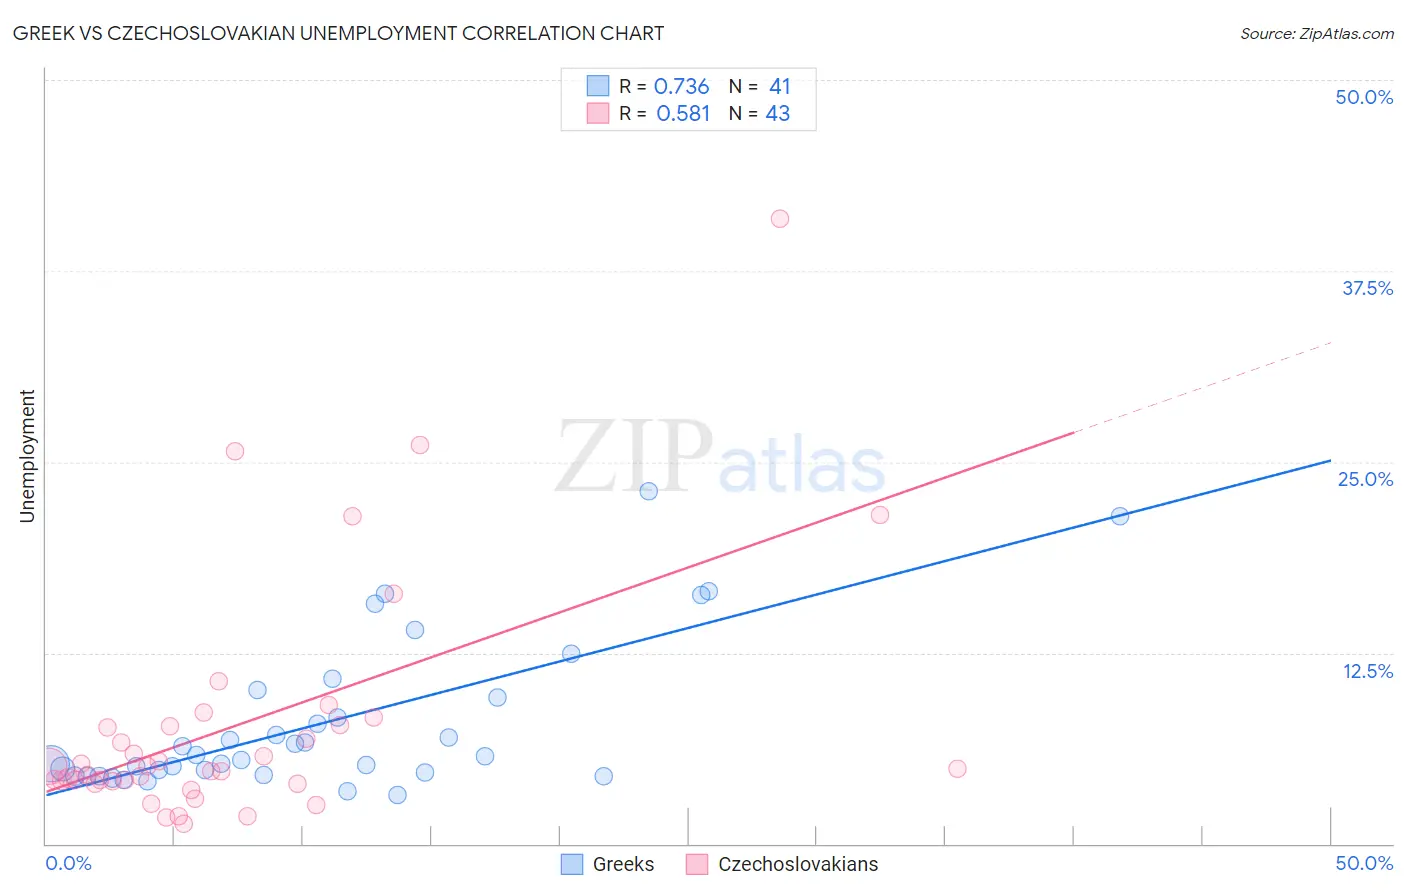
Greek vs Czechoslovakian Unemployment Correlation Chart
The statistical analysis conducted on geographies consisting of 481,787,990 people shows a strong positive correlation between the proportion of Greeks and unemployment in the United States with a correlation coefficient (R) of 0.736 and weighted average of 4.9%. Similarly, the statistical analysis conducted on geographies consisting of 368,083,136 people shows a substantial positive correlation between the proportion of Czechoslovakians and unemployment in the United States with a correlation coefficient (R) of 0.581 and weighted average of 4.8%, a difference of 2.2%.
Unemployment Correlation Summary
| Measurement | Greek | Czechoslovakian |
| Minimum | 3.2% | 1.3% |
| Maximum | 23.1% | 40.9% |
| Range | 19.9% | 39.6% |
| Mean | 8.0% | 7.8% |
| Median | 5.8% | 4.9% |
| Interquartile 25% (IQ1) | 4.6% | 4.1% |
| Interquartile 75% (IQ3) | 9.8% | 7.8% |
| Interquartile Range (IQR) | 5.2% | 3.7% |
| Standard Deviation (Sample) | 5.0% | 8.0% |
| Standard Deviation (Population) | 5.0% | 7.9% |
Similar Demographics by Unemployment
Demographics Similar to Greeks by Unemployment
In terms of unemployment, the demographic groups most similar to Greeks are Bhutanese (4.9%, a difference of 0.030%), Immigrants from Netherlands (4.9%, a difference of 0.070%), Cambodian (4.9%, a difference of 0.070%), Icelander (4.9%, a difference of 0.080%), and Immigrants from Singapore (4.9%, a difference of 0.10%).
| Demographics | Rating | Rank | Unemployment |
| Immigrants | Belgium | 99.2 /100 | #51 | Exceptional 4.9% |
| Whites/Caucasians | 99.2 /100 | #52 | Exceptional 4.9% |
| Immigrants | Zimbabwe | 99.2 /100 | #53 | Exceptional 4.9% |
| Eastern Europeans | 99.2 /100 | #54 | Exceptional 4.9% |
| Australians | 99.2 /100 | #55 | Exceptional 4.9% |
| Celtics | 99.1 /100 | #56 | Exceptional 4.9% |
| Immigrants | Singapore | 99.1 /100 | #57 | Exceptional 4.9% |
| Greeks | 99.0 /100 | #58 | Exceptional 4.9% |
| Bhutanese | 99.0 /100 | #59 | Exceptional 4.9% |
| Immigrants | Netherlands | 99.0 /100 | #60 | Exceptional 4.9% |
| Cambodians | 99.0 /100 | #61 | Exceptional 4.9% |
| Icelanders | 98.9 /100 | #62 | Exceptional 4.9% |
| Immigrants | Bulgaria | 98.9 /100 | #63 | Exceptional 4.9% |
| Italians | 98.9 /100 | #64 | Exceptional 4.9% |
| Immigrants | Canada | 98.8 /100 | #65 | Exceptional 4.9% |
Demographics Similar to Czechoslovakians by Unemployment
In terms of unemployment, the demographic groups most similar to Czechoslovakians are Tongan (4.8%, a difference of 0.070%), Bolivian (4.8%, a difference of 0.19%), Scotch-Irish (4.8%, a difference of 0.29%), Lithuanian (4.8%, a difference of 0.34%), and Northern European (4.8%, a difference of 0.35%).
| Demographics | Rating | Rank | Unemployment |
| Irish | 99.8 /100 | #30 | Exceptional 4.8% |
| Croatians | 99.8 /100 | #31 | Exceptional 4.8% |
| Zimbabweans | 99.8 /100 | #32 | Exceptional 4.8% |
| Sudanese | 99.8 /100 | #33 | Exceptional 4.8% |
| Immigrants | Bolivia | 99.8 /100 | #34 | Exceptional 4.8% |
| Scotch-Irish | 99.8 /100 | #35 | Exceptional 4.8% |
| Tongans | 99.7 /100 | #36 | Exceptional 4.8% |
| Czechoslovakians | 99.7 /100 | #37 | Exceptional 4.8% |
| Bolivians | 99.7 /100 | #38 | Exceptional 4.8% |
| Lithuanians | 99.7 /100 | #39 | Exceptional 4.8% |
| Northern Europeans | 99.7 /100 | #40 | Exceptional 4.8% |
| Immigrants | Bosnia and Herzegovina | 99.7 /100 | #41 | Exceptional 4.8% |
| Filipinos | 99.5 /100 | #42 | Exceptional 4.8% |
| Yugoslavians | 99.5 /100 | #43 | Exceptional 4.8% |
| Austrians | 99.5 /100 | #44 | Exceptional 4.8% |