Barbadian vs Immigrants from Egypt Unemployment
COMPARE
Barbadian
Immigrants from Egypt
Unemployment
Unemployment Comparison
Barbadians
Immigrants from Egypt
6.5%
UNEMPLOYMENT
0.0/ 100
METRIC RATING
308th/ 347
METRIC RANK
5.2%
UNEMPLOYMENT
66.7/ 100
METRIC RATING
158th/ 347
METRIC RANK
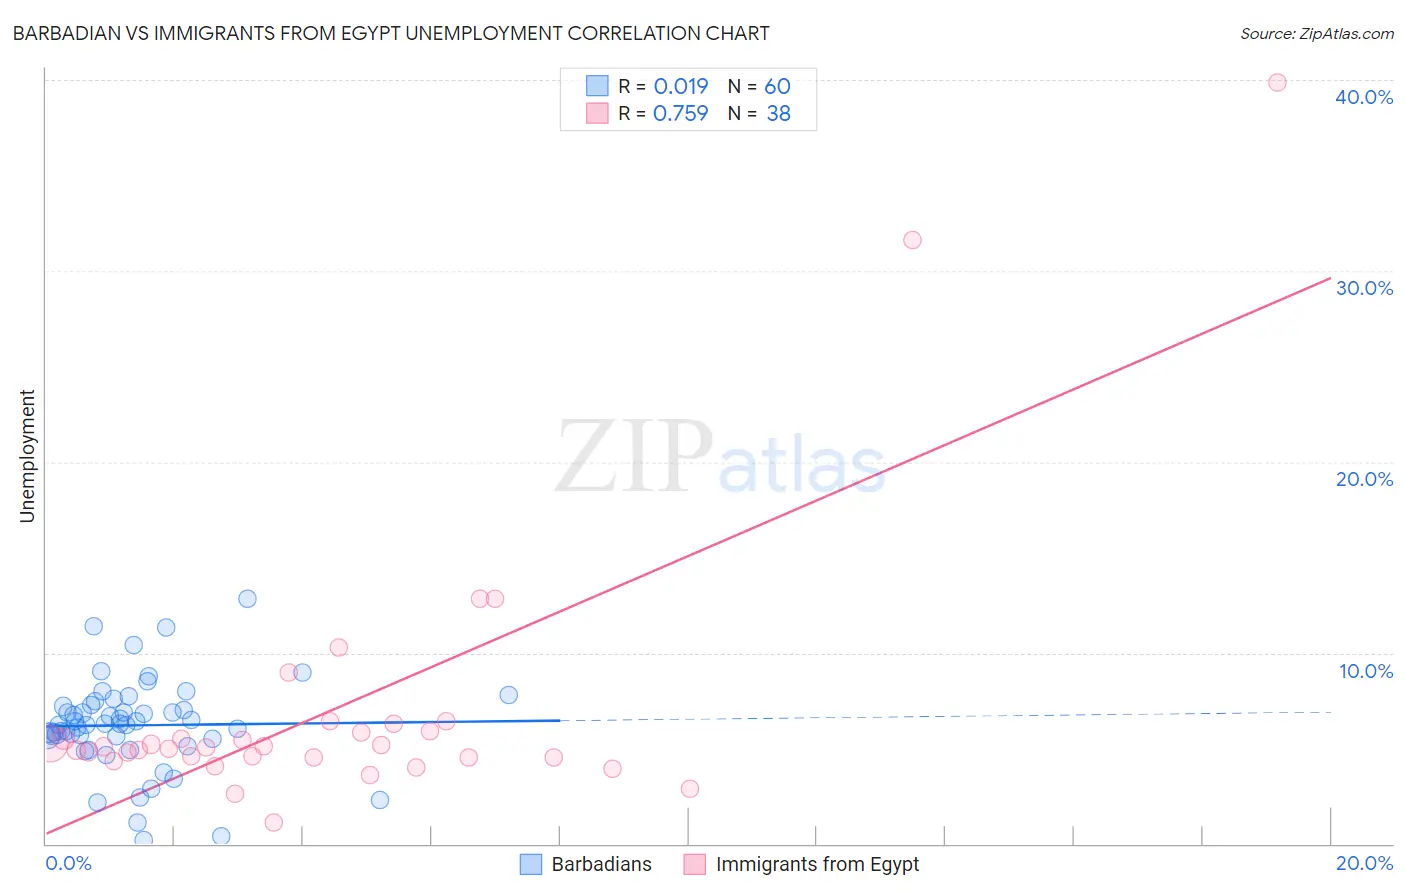
Barbadian vs Immigrants from Egypt Unemployment Correlation Chart
The statistical analysis conducted on geographies consisting of 141,269,105 people shows no correlation between the proportion of Barbadians and unemployment in the United States with a correlation coefficient (R) of 0.019 and weighted average of 6.5%. Similarly, the statistical analysis conducted on geographies consisting of 245,443,113 people shows a strong positive correlation between the proportion of Immigrants from Egypt and unemployment in the United States with a correlation coefficient (R) of 0.759 and weighted average of 5.2%, a difference of 24.8%.
Unemployment Correlation Summary
| Measurement | Barbadian | Immigrants from Egypt |
| Minimum | 0.20% | 1.1% |
| Maximum | 12.8% | 39.9% |
| Range | 12.6% | 38.8% |
| Mean | 6.2% | 7.1% |
| Median | 6.3% | 5.0% |
| Interquartile 25% (IQ1) | 5.6% | 4.5% |
| Interquartile 75% (IQ3) | 7.2% | 5.9% |
| Interquartile Range (IQR) | 1.7% | 1.4% |
| Standard Deviation (Sample) | 2.4% | 7.3% |
| Standard Deviation (Population) | 2.4% | 7.2% |
Similar Demographics by Unemployment
Demographics Similar to Barbadians by Unemployment
In terms of unemployment, the demographic groups most similar to Barbadians are Vietnamese (6.5%, a difference of 0.010%), Immigrants from Belize (6.5%, a difference of 0.28%), Immigrants from Bangladesh (6.5%, a difference of 0.37%), Cape Verdean (6.5%, a difference of 0.61%), and Lumbee (6.4%, a difference of 0.86%).
| Demographics | Rating | Rank | Unemployment |
| Trinidadians and Tobagonians | 0.0 /100 | #301 | Tragic 6.3% |
| West Indians | 0.0 /100 | #302 | Tragic 6.4% |
| Belizeans | 0.0 /100 | #303 | Tragic 6.4% |
| Immigrants | Jamaica | 0.0 /100 | #304 | Tragic 6.4% |
| Menominee | 0.0 /100 | #305 | Tragic 6.4% |
| Lumbee | 0.0 /100 | #306 | Tragic 6.4% |
| Immigrants | Bangladesh | 0.0 /100 | #307 | Tragic 6.5% |
| Barbadians | 0.0 /100 | #308 | Tragic 6.5% |
| Vietnamese | 0.0 /100 | #309 | Tragic 6.5% |
| Immigrants | Belize | 0.0 /100 | #310 | Tragic 6.5% |
| Cape Verdeans | 0.0 /100 | #311 | Tragic 6.5% |
| Colville | 0.0 /100 | #312 | Tragic 6.6% |
| Immigrants | Barbados | 0.0 /100 | #313 | Tragic 6.6% |
| Blacks/African Americans | 0.0 /100 | #314 | Tragic 6.6% |
| Houma | 0.0 /100 | #315 | Tragic 6.7% |
Demographics Similar to Immigrants from Egypt by Unemployment
In terms of unemployment, the demographic groups most similar to Immigrants from Egypt are Immigrants from Russia (5.2%, a difference of 0.0%), Laotian (5.2%, a difference of 0.020%), Immigrants from Oceania (5.2%, a difference of 0.10%), Spanish (5.2%, a difference of 0.11%), and Immigrants from Zaire (5.2%, a difference of 0.13%).
| Demographics | Rating | Rank | Unemployment |
| Immigrants | Eastern Europe | 75.3 /100 | #151 | Good 5.2% |
| Immigrants | Hong Kong | 75.2 /100 | #152 | Good 5.2% |
| Egyptians | 75.2 /100 | #153 | Good 5.2% |
| Immigrants | China | 74.7 /100 | #154 | Good 5.2% |
| Immigrants | Northern Africa | 71.3 /100 | #155 | Good 5.2% |
| Immigrants | Kazakhstan | 70.4 /100 | #156 | Good 5.2% |
| Sri Lankans | 69.5 /100 | #157 | Good 5.2% |
| Immigrants | Egypt | 66.7 /100 | #158 | Good 5.2% |
| Immigrants | Russia | 66.6 /100 | #159 | Good 5.2% |
| Laotians | 66.3 /100 | #160 | Good 5.2% |
| Immigrants | Oceania | 65.2 /100 | #161 | Good 5.2% |
| Spanish | 65.1 /100 | #162 | Good 5.2% |
| Immigrants | Zaire | 64.7 /100 | #163 | Good 5.2% |
| Immigrants | Colombia | 64.7 /100 | #164 | Good 5.2% |
| Immigrants | Brazil | 63.1 /100 | #165 | Good 5.2% |