Zip Codes with the Highest Percentage of Population Employed in Legal Services & Support in North Charleston, SC
RELATED REPORTS & OPTIONS
Legal Services & Support
North Charleston
Compare Zip Codes
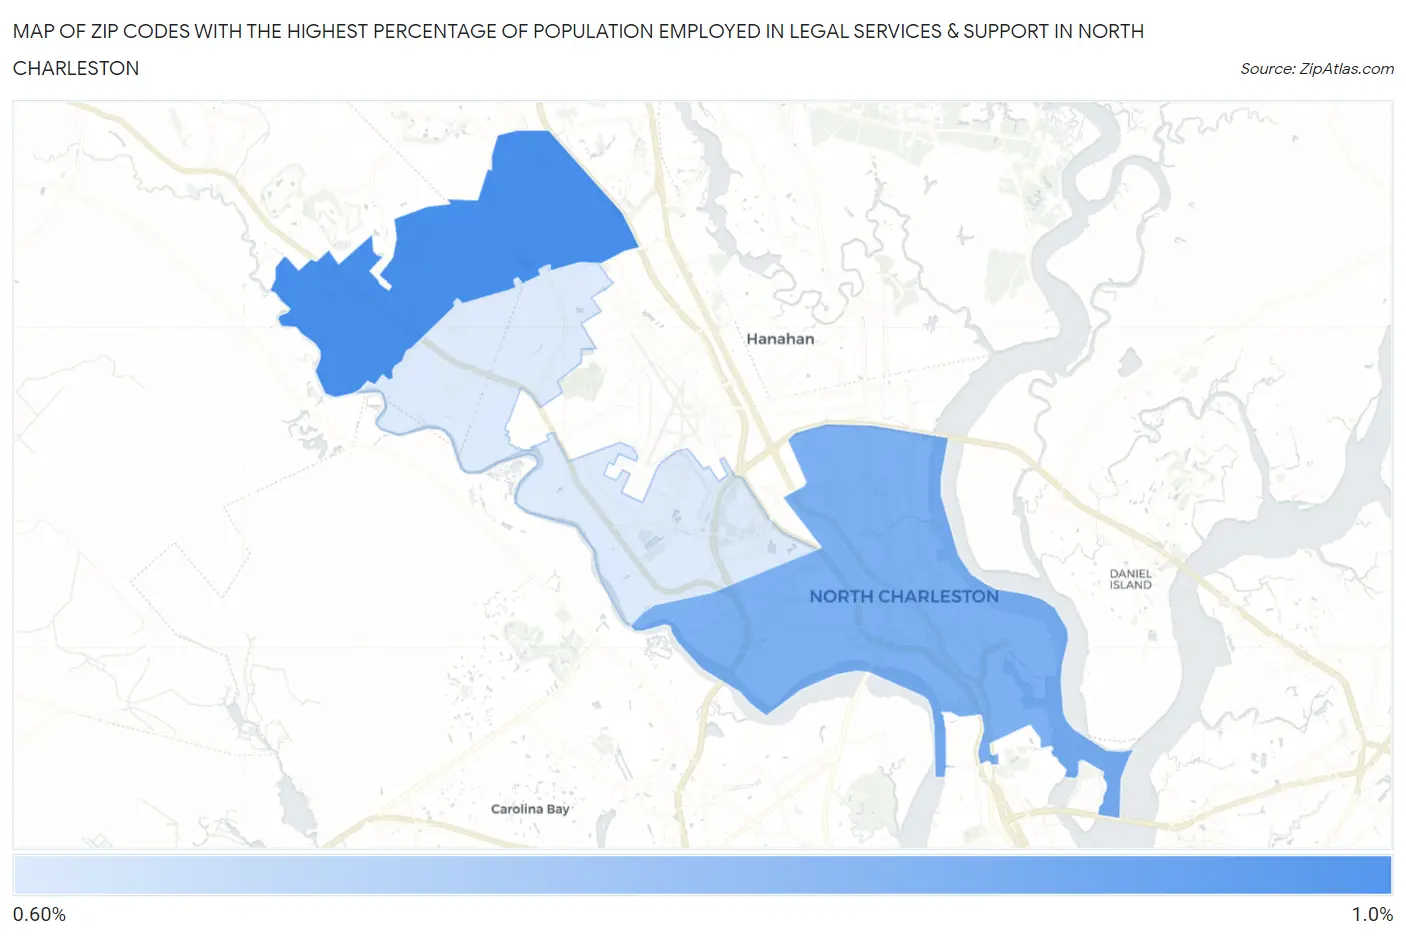
Map of Zip Codes with the Highest Percentage of Population Employed in Legal Services & Support in North Charleston
0.62%
0.84%
Zip Codes with the Highest Percentage of Population Employed in Legal Services & Support in North Charleston, SC
| Zip Code | % Employed | vs State | vs National | |
| 1. | 29420 | 0.84% | 0.97%(-0.139)#109 | 1.2%(-0.349)#9,145 |
| 2. | 29405 | 0.76% | 0.97%(-0.216)#116 | 1.2%(-0.426)#9,837 |
| 3. | 29418 | 0.62% | 0.97%(-0.356)#137 | 1.2%(-0.565)#11,261 |
1
Common Questions
What are the Top Zip Codes with the Highest Percentage of Population Employed in Legal Services & Support in North Charleston, SC?
Top Zip Codes with the Highest Percentage of Population Employed in Legal Services & Support in North Charleston, SC are:
What zip code has the Highest Percentage of Population Employed in Legal Services & Support in North Charleston, SC?
29420 has the Highest Percentage of Population Employed in Legal Services & Support in North Charleston, SC with 0.84%.
What is the Percentage of Population Employed in Legal Services & Support in North Charleston, SC?
Percentage of Population Employed in Legal Services & Support in North Charleston is 0.86%.
What is the Percentage of Population Employed in Legal Services & Support in South Carolina?
Percentage of Population Employed in Legal Services & Support in South Carolina is 0.97%.
What is the Percentage of Population Employed in Legal Services & Support in the United States?
Percentage of Population Employed in Legal Services & Support in the United States is 1.2%.