Zip Codes with the Highest Percentage of Population Employed in Administrative & Support Services in North Charleston, SC
RELATED REPORTS & OPTIONS
Administrative & Support Services
North Charleston
Compare Zip Codes
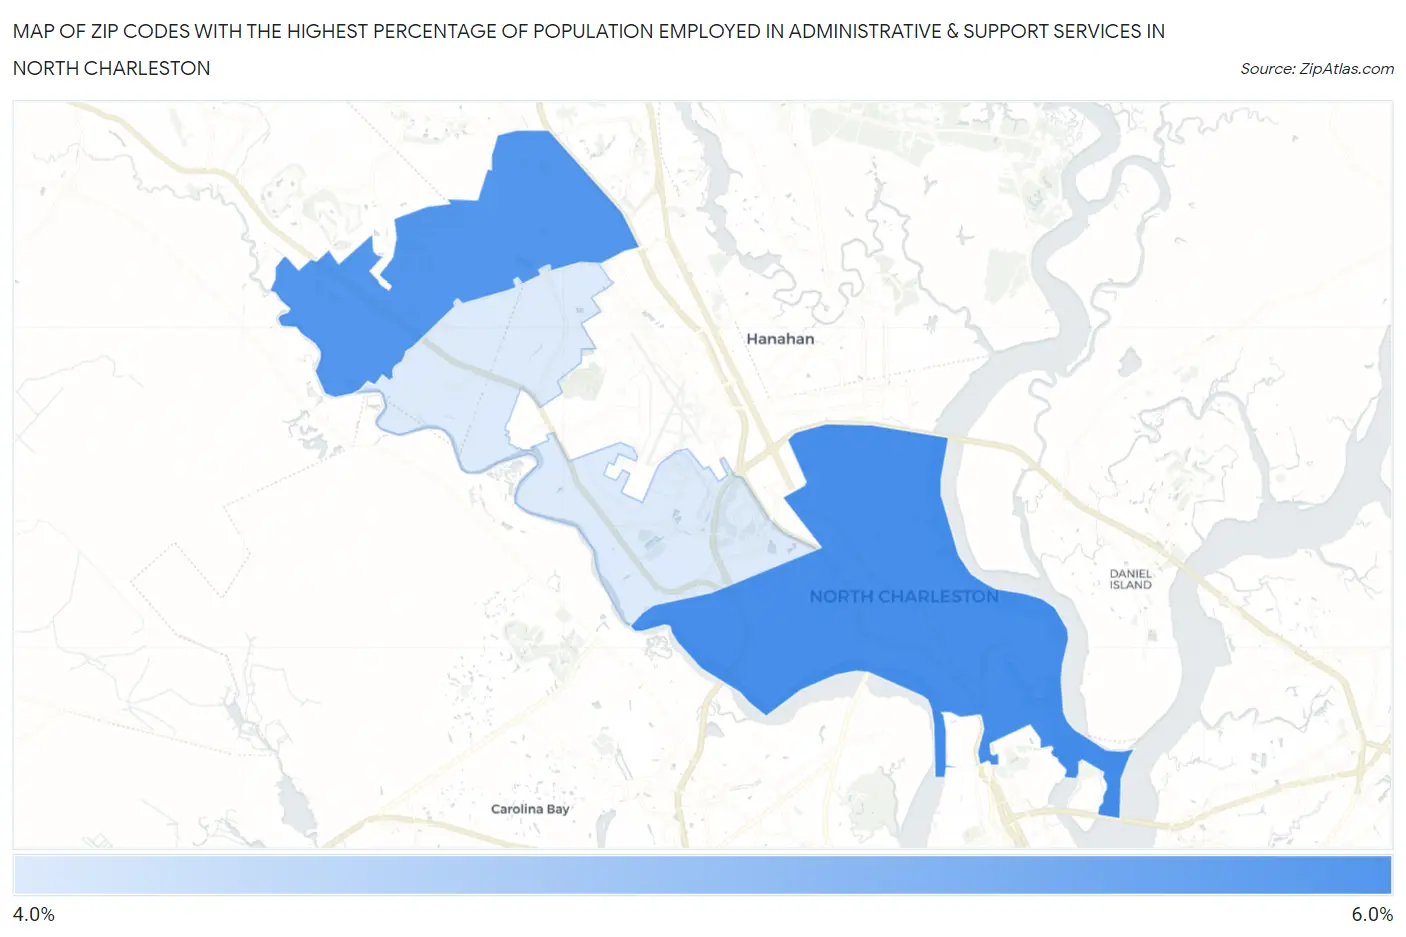
Map of Zip Codes with the Highest Percentage of Population Employed in Administrative & Support Services in North Charleston
4.2%
5.5%
Zip Codes with the Highest Percentage of Population Employed in Administrative & Support Services in North Charleston, SC
| Zip Code | % Employed | vs State | vs National | |
| 1. | 29405 | 5.5% | 4.8%(+0.648)#130 | 4.1%(+1.34)#5,869 |
| 2. | 29420 | 5.4% | 4.8%(+0.541)#132 | 4.1%(+1.23)#6,113 |
| 3. | 29418 | 4.2% | 4.8%(-0.691)#217 | 4.1%(+0.003)#10,021 |
1
Common Questions
What are the Top Zip Codes with the Highest Percentage of Population Employed in Administrative & Support Services in North Charleston, SC?
Top Zip Codes with the Highest Percentage of Population Employed in Administrative & Support Services in North Charleston, SC are:
What zip code has the Highest Percentage of Population Employed in Administrative & Support Services in North Charleston, SC?
29405 has the Highest Percentage of Population Employed in Administrative & Support Services in North Charleston, SC with 5.5%.
What is the Percentage of Population Employed in Administrative & Support Services in North Charleston, SC?
Percentage of Population Employed in Administrative & Support Services in North Charleston is 6.0%.
What is the Percentage of Population Employed in Administrative & Support Services in South Carolina?
Percentage of Population Employed in Administrative & Support Services in South Carolina is 4.8%.
What is the Percentage of Population Employed in Administrative & Support Services in the United States?
Percentage of Population Employed in Administrative & Support Services in the United States is 4.1%.