Zip Codes with the Highest Percentage of Population Employed in Administrative & Support Services in North Augusta, SC
RELATED REPORTS & OPTIONS
Administrative & Support Services
North Augusta
Compare Zip Codes
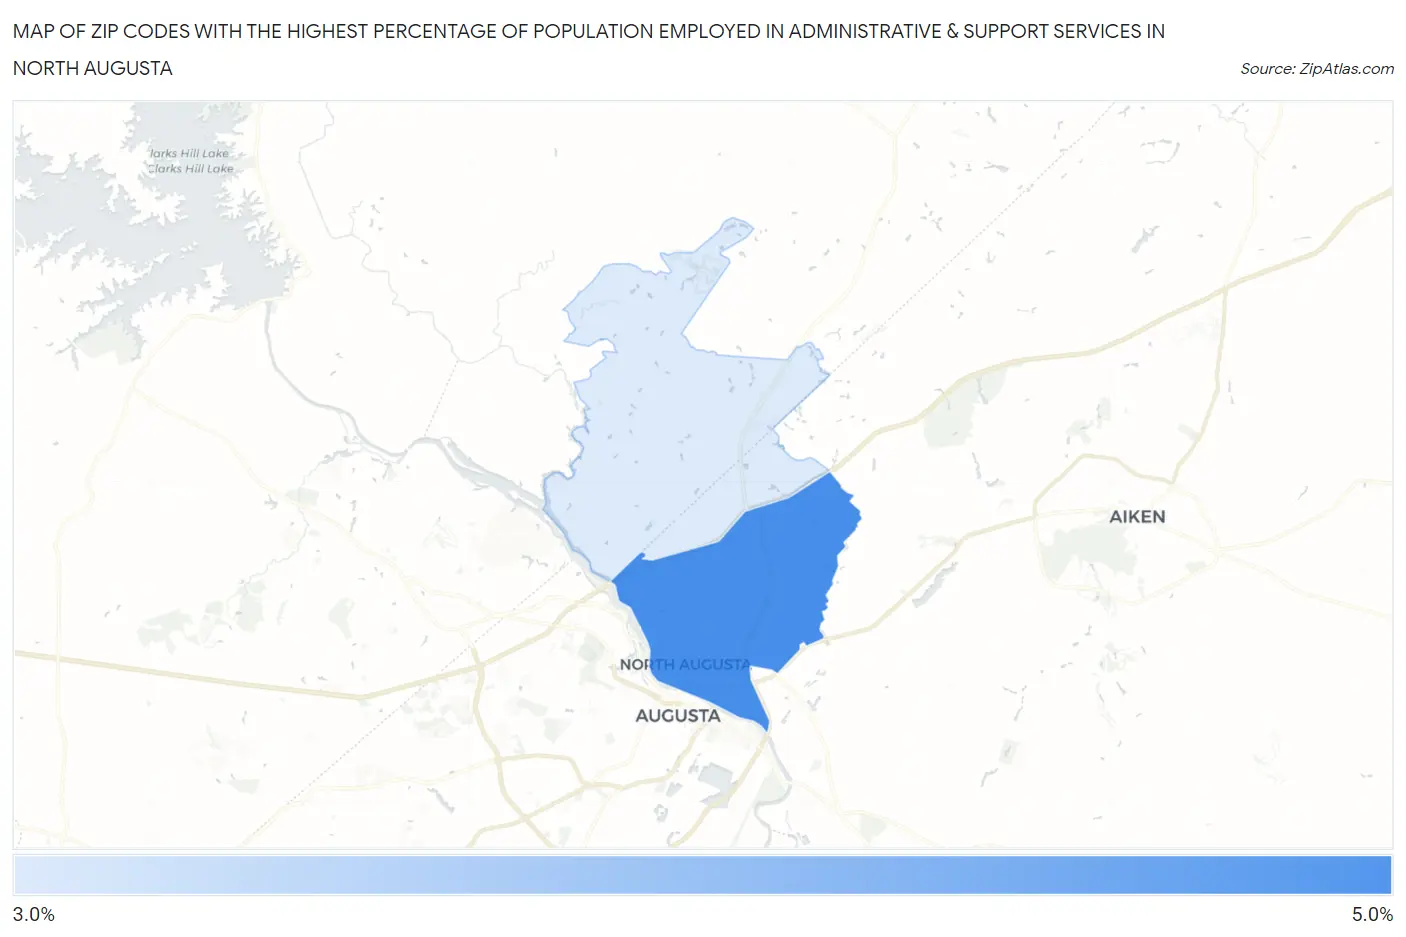
Map of Zip Codes with the Highest Percentage of Population Employed in Administrative & Support Services in North Augusta
3.9%
4.3%
Zip Codes with the Highest Percentage of Population Employed in Administrative & Support Services in North Augusta, SC
| Zip Code | % Employed | vs State | vs National | |
| 1. | 29841 | 4.3% | 4.8%(-0.572)#206 | 4.1%(+0.122)#9,553 |
| 2. | 29860 | 3.9% | 4.8%(-0.952)#237 | 4.1%(-0.258)#11,149 |
1
Common Questions
What are the Top Zip Codes with the Highest Percentage of Population Employed in Administrative & Support Services in North Augusta, SC?
Top Zip Codes with the Highest Percentage of Population Employed in Administrative & Support Services in North Augusta, SC are:
What zip code has the Highest Percentage of Population Employed in Administrative & Support Services in North Augusta, SC?
29841 has the Highest Percentage of Population Employed in Administrative & Support Services in North Augusta, SC with 4.3%.
What is the Percentage of Population Employed in Administrative & Support Services in North Augusta, SC?
Percentage of Population Employed in Administrative & Support Services in North Augusta is 3.7%.
What is the Percentage of Population Employed in Administrative & Support Services in South Carolina?
Percentage of Population Employed in Administrative & Support Services in South Carolina is 4.8%.
What is the Percentage of Population Employed in Administrative & Support Services in the United States?
Percentage of Population Employed in Administrative & Support Services in the United States is 4.1%.