Yup'ik vs Senegalese Disability Age 65 to 74
COMPARE
Yup'ik
Senegalese
Disability Age 65 to 74
Disability Age 65 to 74 Comparison
Yup'ik
Senegalese
37.8%
DISABILITY AGE 65 TO 74
0.0/ 100
METRIC RATING
346th/ 347
METRIC RANK
24.9%
DISABILITY AGE 65 TO 74
0.9/ 100
METRIC RATING
248th/ 347
METRIC RANK
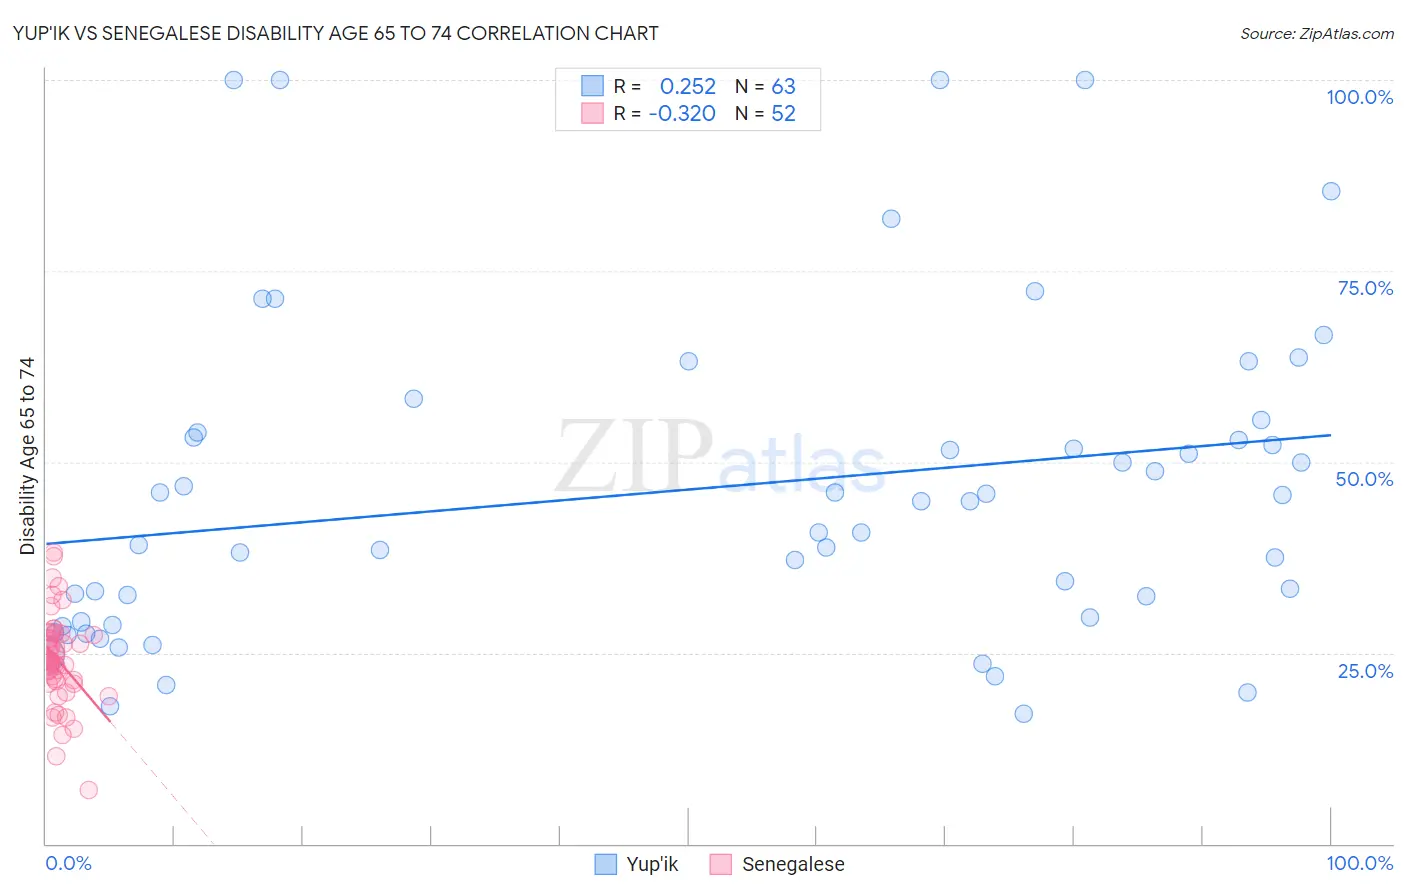
Yup'ik vs Senegalese Disability Age 65 to 74 Correlation Chart
The statistical analysis conducted on geographies consisting of 39,932,947 people shows a weak positive correlation between the proportion of Yup'ik and percentage of population with a disability between the ages 65 and 75 in the United States with a correlation coefficient (R) of 0.252 and weighted average of 37.8%. Similarly, the statistical analysis conducted on geographies consisting of 78,090,599 people shows a mild negative correlation between the proportion of Senegalese and percentage of population with a disability between the ages 65 and 75 in the United States with a correlation coefficient (R) of -0.320 and weighted average of 24.9%, a difference of 51.7%.
Disability Age 65 to 74 Correlation Summary
| Measurement | Yup'ik | Senegalese |
| Minimum | 16.9% | 7.0% |
| Maximum | 100.0% | 38.2% |
| Range | 83.1% | 31.2% |
| Mean | 46.4% | 24.0% |
| Median | 44.8% | 23.9% |
| Interquartile 25% (IQ1) | 29.1% | 21.1% |
| Interquartile 75% (IQ3) | 53.8% | 27.4% |
| Interquartile Range (IQR) | 24.8% | 6.3% |
| Standard Deviation (Sample) | 21.1% | 6.0% |
| Standard Deviation (Population) | 21.0% | 6.0% |
Similar Demographics by Disability Age 65 to 74
Demographics Similar to Yup'ik by Disability Age 65 to 74
In terms of disability age 65 to 74, the demographic groups most similar to Yup'ik are Pima (38.6%, a difference of 2.0%), Tohono O'odham (36.0%, a difference of 5.0%), Inupiat (34.5%, a difference of 9.6%), Navajo (33.3%, a difference of 13.5%), and Pueblo (33.1%, a difference of 14.3%).
| Demographics | Rating | Rank | Disability Age 65 to 74 |
| Colville | 0.0 /100 | #333 | Tragic 30.5% |
| Alaska Natives | 0.0 /100 | #334 | Tragic 30.6% |
| Cheyenne | 0.0 /100 | #335 | Tragic 31.1% |
| Yuman | 0.0 /100 | #336 | Tragic 31.5% |
| Houma | 0.0 /100 | #337 | Tragic 32.3% |
| Alaskan Athabascans | 0.0 /100 | #338 | Tragic 32.4% |
| Kiowa | 0.0 /100 | #339 | Tragic 32.6% |
| Lumbee | 0.0 /100 | #340 | Tragic 32.7% |
| Tsimshian | 0.0 /100 | #341 | Tragic 32.9% |
| Pueblo | 0.0 /100 | #342 | Tragic 33.1% |
| Navajo | 0.0 /100 | #343 | Tragic 33.3% |
| Inupiat | 0.0 /100 | #344 | Tragic 34.5% |
| Tohono O'odham | 0.0 /100 | #345 | Tragic 36.0% |
| Yup'ik | 0.0 /100 | #346 | Tragic 37.8% |
| Pima | 0.0 /100 | #347 | Tragic 38.6% |
Demographics Similar to Senegalese by Disability Age 65 to 74
In terms of disability age 65 to 74, the demographic groups most similar to Senegalese are Immigrants from Fiji (25.0%, a difference of 0.10%), Salvadoran (25.0%, a difference of 0.12%), Indonesian (24.9%, a difference of 0.25%), Nonimmigrants (25.0%, a difference of 0.32%), and Immigrants from El Salvador (25.1%, a difference of 0.51%).
| Demographics | Rating | Rank | Disability Age 65 to 74 |
| Immigrants | Western Africa | 2.3 /100 | #241 | Tragic 24.6% |
| Immigrants | Senegal | 2.2 /100 | #242 | Tragic 24.6% |
| Spanish | 2.2 /100 | #243 | Tragic 24.6% |
| Armenians | 2.0 /100 | #244 | Tragic 24.7% |
| British West Indians | 2.0 /100 | #245 | Tragic 24.7% |
| Immigrants | Iraq | 1.9 /100 | #246 | Tragic 24.7% |
| Indonesians | 1.1 /100 | #247 | Tragic 24.9% |
| Senegalese | 0.9 /100 | #248 | Tragic 24.9% |
| Immigrants | Fiji | 0.8 /100 | #249 | Tragic 25.0% |
| Salvadorans | 0.8 /100 | #250 | Tragic 25.0% |
| Immigrants | Nonimmigrants | 0.7 /100 | #251 | Tragic 25.0% |
| Immigrants | El Salvador | 0.6 /100 | #252 | Tragic 25.1% |
| Sub-Saharan Africans | 0.6 /100 | #253 | Tragic 25.1% |
| Somalis | 0.6 /100 | #254 | Tragic 25.1% |
| Central Americans | 0.5 /100 | #255 | Tragic 25.1% |