Yakama vs Navajo Disability Age Under 5
COMPARE
Yakama
Navajo
Disability Age Under 5
Disability Age Under 5 Comparison
Yakama
Navajo
1.00%
DISABILITY AGE UNDER 5
100.0/ 100
METRIC RATING
23rd/ 347
METRIC RANK
1.6%
DISABILITY AGE UNDER 5
0.0/ 100
METRIC RATING
308th/ 347
METRIC RANK
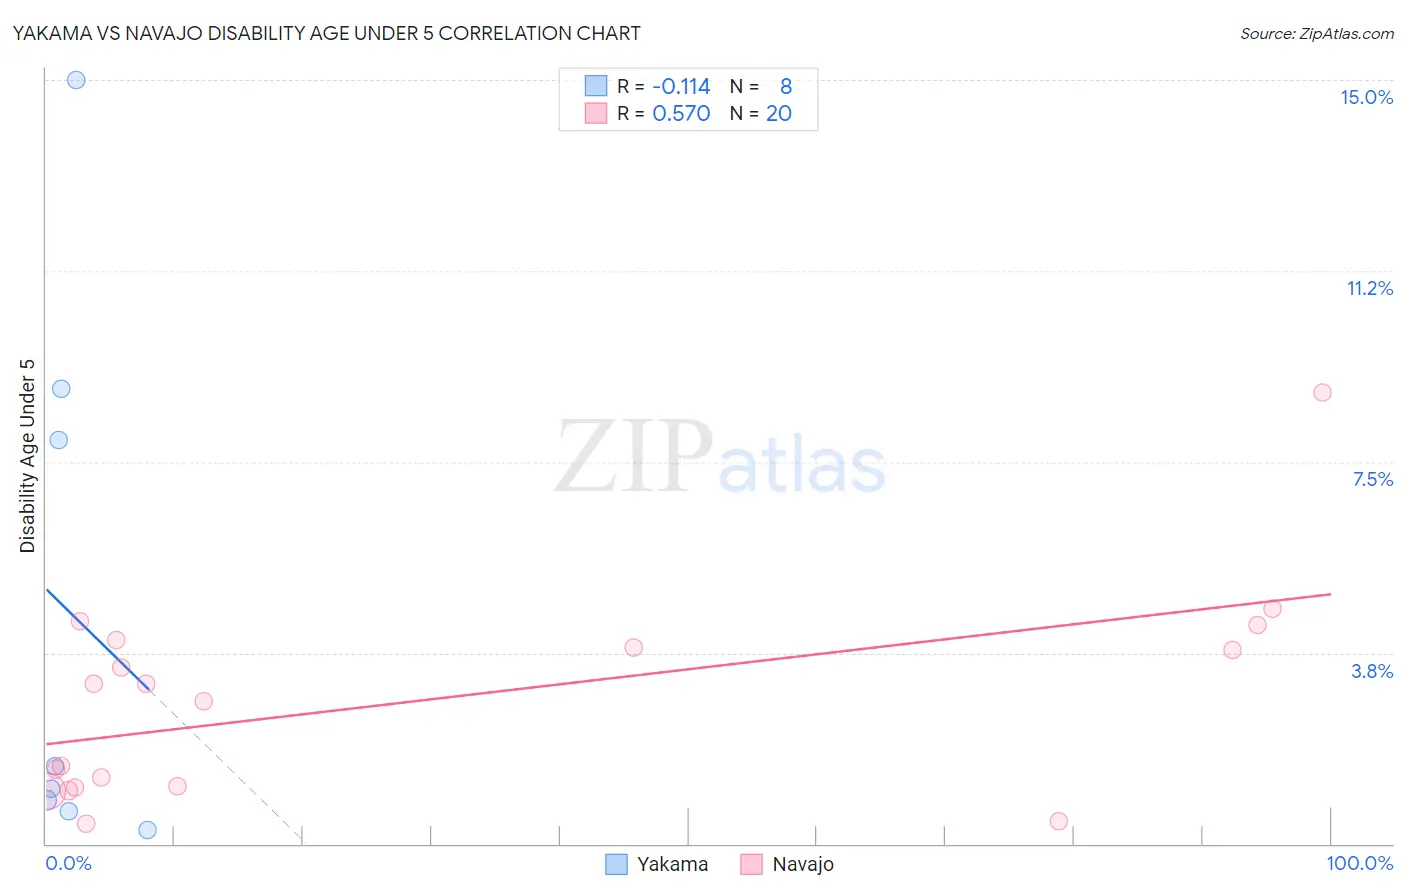
Yakama vs Navajo Disability Age Under 5 Correlation Chart
The statistical analysis conducted on geographies consisting of 15,694,723 people shows a poor negative correlation between the proportion of Yakama and percentage of population with a disability under the age of 5 in the United States with a correlation coefficient (R) of -0.114 and weighted average of 1.00%. Similarly, the statistical analysis conducted on geographies consisting of 151,471,391 people shows a substantial positive correlation between the proportion of Navajo and percentage of population with a disability under the age of 5 in the United States with a correlation coefficient (R) of 0.570 and weighted average of 1.6%, a difference of 65.0%.
Disability Age Under 5 Correlation Summary
| Measurement | Yakama | Navajo |
| Minimum | 0.27% | 0.40% |
| Maximum | 15.0% | 8.9% |
| Range | 14.7% | 8.5% |
| Mean | 4.5% | 2.8% |
| Median | 1.3% | 3.0% |
| Interquartile 25% (IQ1) | 0.74% | 1.1% |
| Interquartile 75% (IQ3) | 8.4% | 3.9% |
| Interquartile Range (IQR) | 7.7% | 2.8% |
| Standard Deviation (Sample) | 5.5% | 2.0% |
| Standard Deviation (Population) | 5.1% | 2.0% |
Similar Demographics by Disability Age Under 5
Demographics Similar to Yakama by Disability Age Under 5
In terms of disability age under 5, the demographic groups most similar to Yakama are Immigrants from Iran (1.00%, a difference of 0.080%), Indian (Asian) (1.0%, a difference of 0.28%), Immigrants from Micronesia (1.0%, a difference of 0.59%), Immigrants from Taiwan (1.0%, a difference of 0.72%), and British West Indian (0.99%, a difference of 0.87%).
| Demographics | Rating | Rank | Disability Age Under 5 |
| Immigrants | Israel | 100.0 /100 | #16 | Exceptional 0.96% |
| Immigrants | China | 100.0 /100 | #17 | Exceptional 0.96% |
| Immigrants | Barbados | 100.0 /100 | #18 | Exceptional 0.97% |
| Puget Sound Salish | 100.0 /100 | #19 | Exceptional 0.97% |
| Nepalese | 100.0 /100 | #20 | Exceptional 0.97% |
| British West Indians | 100.0 /100 | #21 | Exceptional 0.99% |
| Immigrants | Iran | 100.0 /100 | #22 | Exceptional 1.00% |
| Yakama | 100.0 /100 | #23 | Exceptional 1.00% |
| Indians (Asian) | 100.0 /100 | #24 | Exceptional 1.0% |
| Immigrants | Micronesia | 100.0 /100 | #25 | Exceptional 1.0% |
| Immigrants | Taiwan | 100.0 /100 | #26 | Exceptional 1.0% |
| Guyanese | 100.0 /100 | #27 | Exceptional 1.0% |
| Immigrants | Eastern Asia | 100.0 /100 | #28 | Exceptional 1.0% |
| Immigrants | Belarus | 100.0 /100 | #29 | Exceptional 1.0% |
| Immigrants | South Central Asia | 99.9 /100 | #30 | Exceptional 1.0% |
Demographics Similar to Navajo by Disability Age Under 5
In terms of disability age under 5, the demographic groups most similar to Navajo are Scottish (1.6%, a difference of 0.14%), Creek (1.6%, a difference of 0.21%), Blackfeet (1.6%, a difference of 0.25%), Seminole (1.6%, a difference of 0.40%), and Cape Verdean (1.7%, a difference of 0.63%).
| Demographics | Rating | Rank | Disability Age Under 5 |
| German Russians | 0.0 /100 | #301 | Tragic 1.6% |
| Welsh | 0.0 /100 | #302 | Tragic 1.6% |
| Swiss | 0.0 /100 | #303 | Tragic 1.6% |
| Seminole | 0.0 /100 | #304 | Tragic 1.6% |
| Blackfeet | 0.0 /100 | #305 | Tragic 1.6% |
| Creek | 0.0 /100 | #306 | Tragic 1.6% |
| Scottish | 0.0 /100 | #307 | Tragic 1.6% |
| Navajo | 0.0 /100 | #308 | Tragic 1.6% |
| Cape Verdeans | 0.0 /100 | #309 | Tragic 1.7% |
| Whites/Caucasians | 0.0 /100 | #310 | Tragic 1.7% |
| English | 0.0 /100 | #311 | Tragic 1.7% |
| Puerto Ricans | 0.0 /100 | #312 | Tragic 1.7% |
| Celtics | 0.0 /100 | #313 | Tragic 1.7% |
| Norwegians | 0.0 /100 | #314 | Tragic 1.7% |
| Dutch | 0.0 /100 | #315 | Tragic 1.7% |