Nigerian vs Navajo Single Female Poverty
COMPARE
Nigerian
Navajo
Single Female Poverty
Single Female Poverty Comparison
Nigerians
Navajo
21.4%
SINGLE FEMALE POVERTY
20.9/ 100
METRIC RATING
201st/ 347
METRIC RANK
31.7%
SINGLE FEMALE POVERTY
0.0/ 100
METRIC RATING
342nd/ 347
METRIC RANK
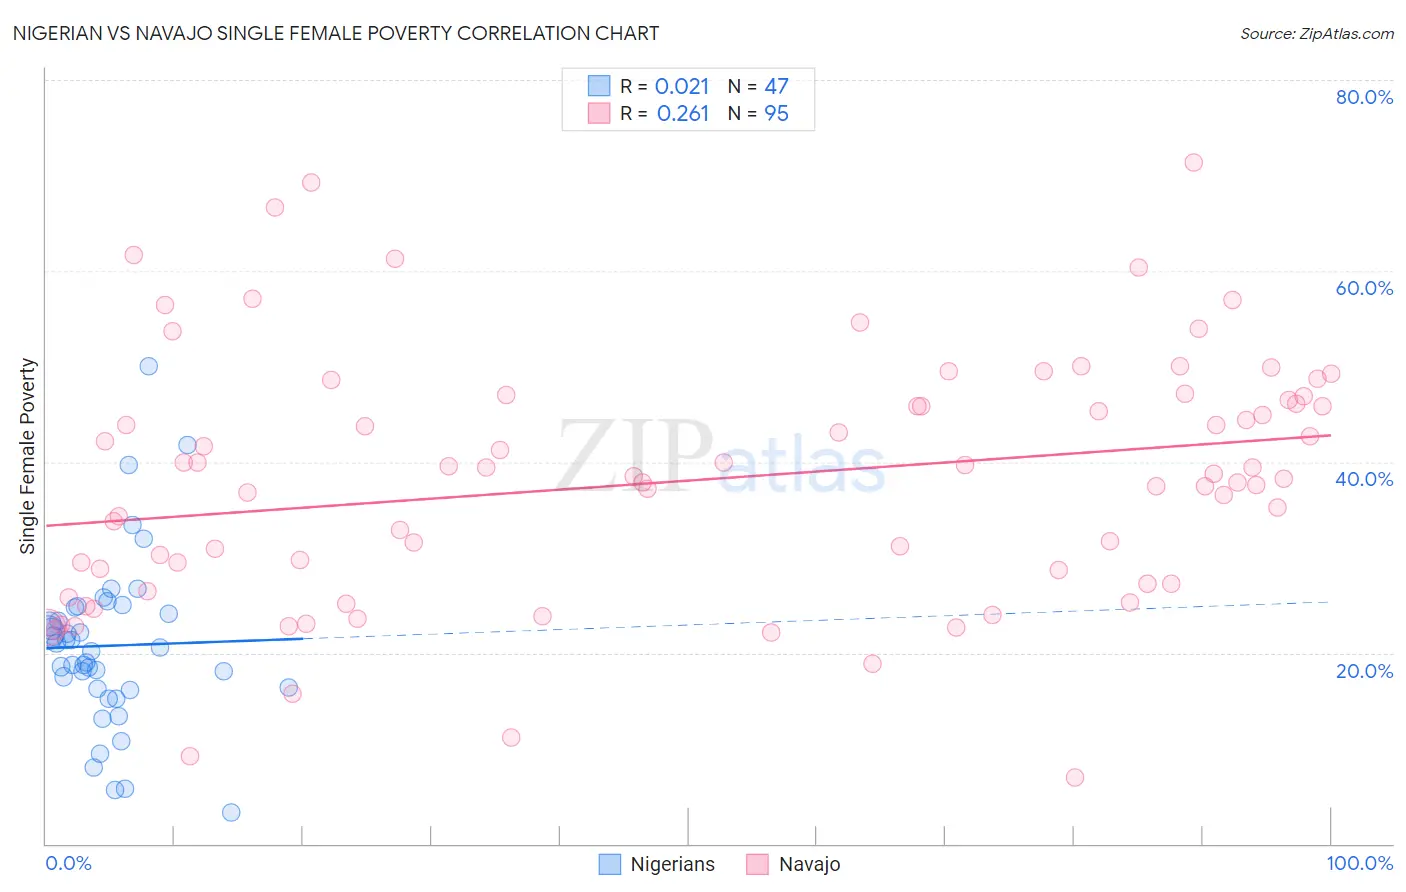
Nigerian vs Navajo Single Female Poverty Correlation Chart
The statistical analysis conducted on geographies consisting of 330,209,143 people shows no correlation between the proportion of Nigerians and poverty level among single females in the United States with a correlation coefficient (R) of 0.021 and weighted average of 21.4%. Similarly, the statistical analysis conducted on geographies consisting of 223,343,663 people shows a weak positive correlation between the proportion of Navajo and poverty level among single females in the United States with a correlation coefficient (R) of 0.261 and weighted average of 31.7%, a difference of 47.6%.
Single Female Poverty Correlation Summary
| Measurement | Nigerian | Navajo |
| Minimum | 3.3% | 7.0% |
| Maximum | 50.0% | 71.4% |
| Range | 46.7% | 64.4% |
| Mean | 20.7% | 38.1% |
| Median | 20.5% | 38.5% |
| Interquartile 25% (IQ1) | 16.2% | 27.3% |
| Interquartile 75% (IQ3) | 24.8% | 46.5% |
| Interquartile Range (IQR) | 8.6% | 19.3% |
| Standard Deviation (Sample) | 8.8% | 13.1% |
| Standard Deviation (Population) | 8.7% | 13.0% |
Similar Demographics by Single Female Poverty
Demographics Similar to Nigerians by Single Female Poverty
In terms of single female poverty, the demographic groups most similar to Nigerians are Immigrants from Kenya (21.4%, a difference of 0.020%), Irish (21.4%, a difference of 0.040%), Immigrants (21.4%, a difference of 0.10%), Immigrants from Haiti (21.5%, a difference of 0.20%), and Swiss (21.4%, a difference of 0.29%).
| Demographics | Rating | Rank | Single Female Poverty |
| Czechoslovakians | 27.7 /100 | #194 | Fair 21.3% |
| Nicaraguans | 27.6 /100 | #195 | Fair 21.3% |
| Immigrants | Saudi Arabia | 27.1 /100 | #196 | Fair 21.3% |
| Japanese | 26.4 /100 | #197 | Fair 21.3% |
| Swiss | 24.2 /100 | #198 | Fair 21.4% |
| Immigrants | Immigrants | 22.0 /100 | #199 | Fair 21.4% |
| Irish | 21.4 /100 | #200 | Fair 21.4% |
| Nigerians | 20.9 /100 | #201 | Fair 21.4% |
| Immigrants | Kenya | 20.7 /100 | #202 | Fair 21.4% |
| Immigrants | Haiti | 18.8 /100 | #203 | Poor 21.5% |
| Immigrants | Africa | 16.7 /100 | #204 | Poor 21.5% |
| Finns | 16.2 /100 | #205 | Poor 21.5% |
| Belgians | 16.1 /100 | #206 | Poor 21.5% |
| Ghanaians | 15.7 /100 | #207 | Poor 21.6% |
| Haitians | 15.4 /100 | #208 | Poor 21.6% |
Demographics Similar to Navajo by Single Female Poverty
In terms of single female poverty, the demographic groups most similar to Navajo are Sioux (31.3%, a difference of 1.3%), Crow (32.4%, a difference of 2.4%), Cajun (30.6%, a difference of 3.3%), Cheyenne (30.4%, a difference of 4.1%), and Lumbee (33.0%, a difference of 4.3%).
| Demographics | Rating | Rank | Single Female Poverty |
| Ute | 0.0 /100 | #333 | Tragic 28.4% |
| Pueblo | 0.0 /100 | #334 | Tragic 28.6% |
| Immigrants | Yemen | 0.0 /100 | #335 | Tragic 28.9% |
| Colville | 0.0 /100 | #336 | Tragic 29.1% |
| Yuman | 0.0 /100 | #337 | Tragic 29.4% |
| Pima | 0.0 /100 | #338 | Tragic 30.3% |
| Cheyenne | 0.0 /100 | #339 | Tragic 30.4% |
| Cajuns | 0.0 /100 | #340 | Tragic 30.6% |
| Sioux | 0.0 /100 | #341 | Tragic 31.3% |
| Navajo | 0.0 /100 | #342 | Tragic 31.7% |
| Crow | 0.0 /100 | #343 | Tragic 32.4% |
| Lumbee | 0.0 /100 | #344 | Tragic 33.0% |
| Houma | 0.0 /100 | #345 | Tragic 33.8% |
| Puerto Ricans | 0.0 /100 | #346 | Tragic 34.1% |
| Tohono O'odham | 0.0 /100 | #347 | Tragic 34.2% |