Estonian vs Navajo Single Female Poverty
COMPARE
Estonian
Navajo
Single Female Poverty
Single Female Poverty Comparison
Estonians
Navajo
19.7%
SINGLE FEMALE POVERTY
98.2/ 100
METRIC RATING
95th/ 347
METRIC RANK
31.7%
SINGLE FEMALE POVERTY
0.0/ 100
METRIC RATING
342nd/ 347
METRIC RANK
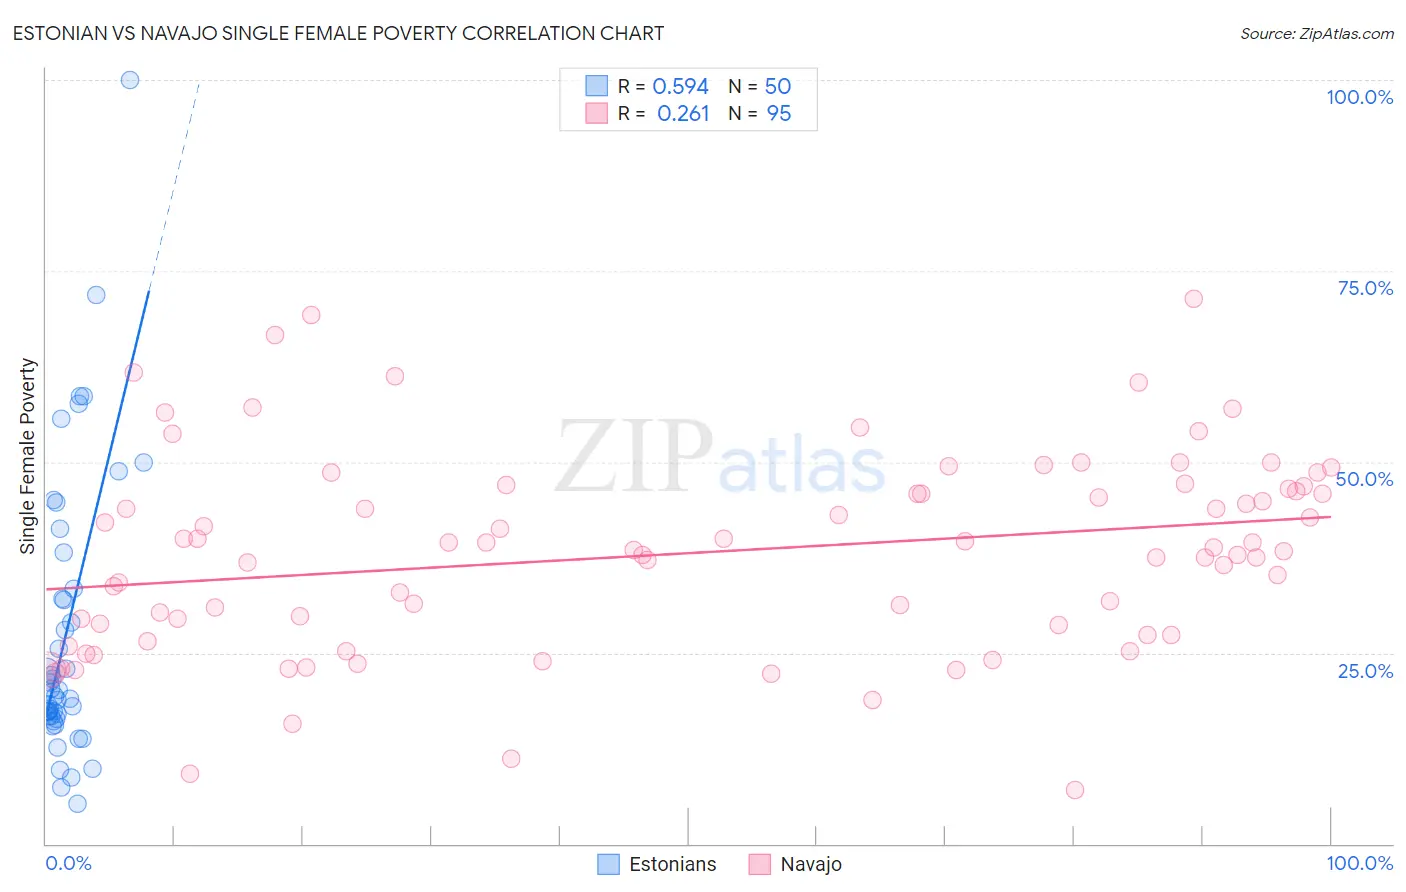
Estonian vs Navajo Single Female Poverty Correlation Chart
The statistical analysis conducted on geographies consisting of 122,383,678 people shows a substantial positive correlation between the proportion of Estonians and poverty level among single females in the United States with a correlation coefficient (R) of 0.594 and weighted average of 19.7%. Similarly, the statistical analysis conducted on geographies consisting of 223,343,663 people shows a weak positive correlation between the proportion of Navajo and poverty level among single females in the United States with a correlation coefficient (R) of 0.261 and weighted average of 31.7%, a difference of 60.7%.
Single Female Poverty Correlation Summary
| Measurement | Estonian | Navajo |
| Minimum | 5.3% | 7.0% |
| Maximum | 100.0% | 71.4% |
| Range | 94.7% | 64.4% |
| Mean | 27.5% | 38.1% |
| Median | 19.7% | 38.5% |
| Interquartile 25% (IQ1) | 16.7% | 27.3% |
| Interquartile 75% (IQ3) | 33.3% | 46.5% |
| Interquartile Range (IQR) | 16.6% | 19.3% |
| Standard Deviation (Sample) | 18.8% | 13.1% |
| Standard Deviation (Population) | 18.6% | 13.0% |
Similar Demographics by Single Female Poverty
Demographics Similar to Estonians by Single Female Poverty
In terms of single female poverty, the demographic groups most similar to Estonians are Immigrants from Brazil (19.7%, a difference of 0.050%), Croatian (19.7%, a difference of 0.14%), Immigrants from France (19.7%, a difference of 0.26%), Sierra Leonean (19.7%, a difference of 0.28%), and Romanian (19.6%, a difference of 0.38%).
| Demographics | Rating | Rank | Single Female Poverty |
| Afghans | 99.0 /100 | #88 | Exceptional 19.5% |
| Immigrants | Ukraine | 99.0 /100 | #89 | Exceptional 19.5% |
| Immigrants | Lebanon | 98.8 /100 | #90 | Exceptional 19.6% |
| Soviet Union | 98.8 /100 | #91 | Exceptional 19.6% |
| Italians | 98.8 /100 | #92 | Exceptional 19.6% |
| Immigrants | Austria | 98.8 /100 | #93 | Exceptional 19.6% |
| Romanians | 98.6 /100 | #94 | Exceptional 19.6% |
| Estonians | 98.2 /100 | #95 | Exceptional 19.7% |
| Immigrants | Brazil | 98.2 /100 | #96 | Exceptional 19.7% |
| Croatians | 98.1 /100 | #97 | Exceptional 19.7% |
| Immigrants | France | 97.9 /100 | #98 | Exceptional 19.7% |
| Sierra Leoneans | 97.9 /100 | #99 | Exceptional 19.7% |
| Ukrainians | 97.6 /100 | #100 | Exceptional 19.8% |
| Immigrants | Belgium | 97.3 /100 | #101 | Exceptional 19.8% |
| Immigrants | Cameroon | 97.3 /100 | #102 | Exceptional 19.8% |
Demographics Similar to Navajo by Single Female Poverty
In terms of single female poverty, the demographic groups most similar to Navajo are Sioux (31.3%, a difference of 1.3%), Crow (32.4%, a difference of 2.4%), Cajun (30.6%, a difference of 3.3%), Cheyenne (30.4%, a difference of 4.1%), and Lumbee (33.0%, a difference of 4.3%).
| Demographics | Rating | Rank | Single Female Poverty |
| Ute | 0.0 /100 | #333 | Tragic 28.4% |
| Pueblo | 0.0 /100 | #334 | Tragic 28.6% |
| Immigrants | Yemen | 0.0 /100 | #335 | Tragic 28.9% |
| Colville | 0.0 /100 | #336 | Tragic 29.1% |
| Yuman | 0.0 /100 | #337 | Tragic 29.4% |
| Pima | 0.0 /100 | #338 | Tragic 30.3% |
| Cheyenne | 0.0 /100 | #339 | Tragic 30.4% |
| Cajuns | 0.0 /100 | #340 | Tragic 30.6% |
| Sioux | 0.0 /100 | #341 | Tragic 31.3% |
| Navajo | 0.0 /100 | #342 | Tragic 31.7% |
| Crow | 0.0 /100 | #343 | Tragic 32.4% |
| Lumbee | 0.0 /100 | #344 | Tragic 33.0% |
| Houma | 0.0 /100 | #345 | Tragic 33.8% |
| Puerto Ricans | 0.0 /100 | #346 | Tragic 34.1% |
| Tohono O'odham | 0.0 /100 | #347 | Tragic 34.2% |