White/Caucasian vs Bermudan Married-Couple Family Poverty
COMPARE
White/Caucasian
Bermudan
Married-Couple Family Poverty
Married-Couple Family Poverty Comparison
Whites/Caucasians
Bermudans
4.8%
MARRIED-COUPLE FAMILY POVERTY
93.1/ 100
METRIC RATING
122nd/ 347
METRIC RANK
5.2%
MARRIED-COUPLE FAMILY POVERTY
52.9/ 100
METRIC RATING
171st/ 347
METRIC RANK
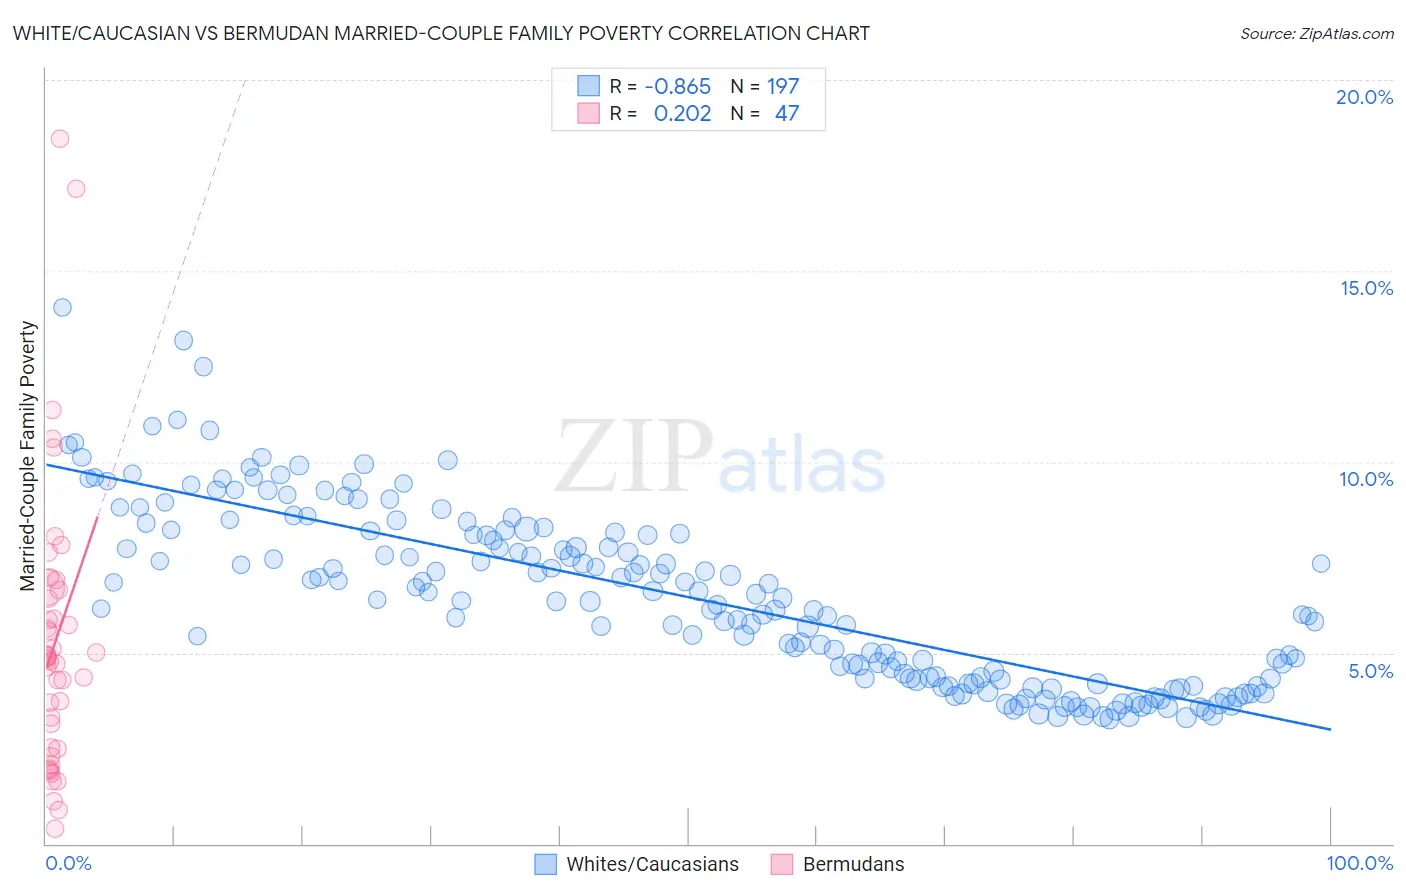
White/Caucasian vs Bermudan Married-Couple Family Poverty Correlation Chart
The statistical analysis conducted on geographies consisting of 566,545,567 people shows a very strong negative correlation between the proportion of Whites/Caucasians and poverty level among married-couple families in the United States with a correlation coefficient (R) of -0.865 and weighted average of 4.8%. Similarly, the statistical analysis conducted on geographies consisting of 55,613,061 people shows a weak positive correlation between the proportion of Bermudans and poverty level among married-couple families in the United States with a correlation coefficient (R) of 0.202 and weighted average of 5.2%, a difference of 7.8%.
Married-Couple Family Poverty Correlation Summary
| Measurement | White/Caucasian | Bermudan |
| Minimum | 3.3% | 0.39% |
| Maximum | 14.0% | 18.5% |
| Range | 10.8% | 18.1% |
| Mean | 6.4% | 5.3% |
| Median | 6.3% | 4.9% |
| Interquartile 25% (IQ1) | 4.3% | 2.5% |
| Interquartile 75% (IQ3) | 8.1% | 6.6% |
| Interquartile Range (IQR) | 3.9% | 4.1% |
| Standard Deviation (Sample) | 2.3% | 3.7% |
| Standard Deviation (Population) | 2.3% | 3.6% |
Similar Demographics by Married-Couple Family Poverty
Demographics Similar to Whites/Caucasians by Married-Couple Family Poverty
In terms of married-couple family poverty, the demographic groups most similar to Whites/Caucasians are Jordanian (4.8%, a difference of 0.020%), Indian (Asian) (4.8%, a difference of 0.050%), Immigrants from Southern Europe (4.8%, a difference of 0.14%), Romanian (4.8%, a difference of 0.29%), and Immigrants from Bosnia and Herzegovina (4.8%, a difference of 0.30%).
| Demographics | Rating | Rank | Married-Couple Family Poverty |
| Taiwanese | 94.8 /100 | #115 | Exceptional 4.8% |
| Celtics | 94.8 /100 | #116 | Exceptional 4.8% |
| Kenyans | 94.7 /100 | #117 | Exceptional 4.8% |
| Immigrants | Philippines | 94.6 /100 | #118 | Exceptional 4.8% |
| Immigrants | Eastern Asia | 94.0 /100 | #119 | Exceptional 4.8% |
| Immigrants | Southern Europe | 93.4 /100 | #120 | Exceptional 4.8% |
| Indians (Asian) | 93.2 /100 | #121 | Exceptional 4.8% |
| Whites/Caucasians | 93.1 /100 | #122 | Exceptional 4.8% |
| Jordanians | 93.1 /100 | #123 | Exceptional 4.8% |
| Romanians | 92.5 /100 | #124 | Exceptional 4.8% |
| Immigrants | Bosnia and Herzegovina | 92.5 /100 | #125 | Exceptional 4.8% |
| Immigrants | Asia | 92.3 /100 | #126 | Exceptional 4.8% |
| Egyptians | 92.0 /100 | #127 | Exceptional 4.8% |
| Palestinians | 91.2 /100 | #128 | Exceptional 4.9% |
| Immigrants | Pakistan | 90.7 /100 | #129 | Exceptional 4.9% |
Demographics Similar to Bermudans by Married-Couple Family Poverty
In terms of married-couple family poverty, the demographic groups most similar to Bermudans are Immigrants from Argentina (5.2%, a difference of 0.18%), Immigrants from Northern Africa (5.2%, a difference of 0.18%), Ottawa (5.2%, a difference of 0.19%), Alsatian (5.2%, a difference of 0.20%), and Immigrants from Uganda (5.2%, a difference of 0.23%).
| Demographics | Rating | Rank | Married-Couple Family Poverty |
| Hawaiians | 62.3 /100 | #164 | Good 5.1% |
| Immigrants | Malaysia | 62.2 /100 | #165 | Good 5.1% |
| Paraguayans | 61.5 /100 | #166 | Good 5.1% |
| Costa Ricans | 61.5 /100 | #167 | Good 5.1% |
| Immigrants | Uganda | 54.9 /100 | #168 | Average 5.2% |
| Ottawa | 54.5 /100 | #169 | Average 5.2% |
| Immigrants | Argentina | 54.4 /100 | #170 | Average 5.2% |
| Bermudans | 52.9 /100 | #171 | Average 5.2% |
| Immigrants | Northern Africa | 51.3 /100 | #172 | Average 5.2% |
| Alsatians | 51.2 /100 | #173 | Average 5.2% |
| Immigrants | Eastern Africa | 50.0 /100 | #174 | Average 5.2% |
| Marshallese | 47.9 /100 | #175 | Average 5.2% |
| Menominee | 47.8 /100 | #176 | Average 5.2% |
| Immigrants | Kazakhstan | 45.1 /100 | #177 | Average 5.2% |
| Immigrants | Ukraine | 44.9 /100 | #178 | Average 5.2% |