White/Caucasian vs Bermudan Single Mother Households
COMPARE
White/Caucasian
Bermudan
Single Mother Households
Single Mother Households Comparison
Whites/Caucasians
Bermudans
6.1%
SINGLE MOTHER HOUSEHOLDS
76.5/ 100
METRIC RATING
155th/ 347
METRIC RANK
7.3%
SINGLE MOTHER HOUSEHOLDS
0.4/ 100
METRIC RATING
249th/ 347
METRIC RANK
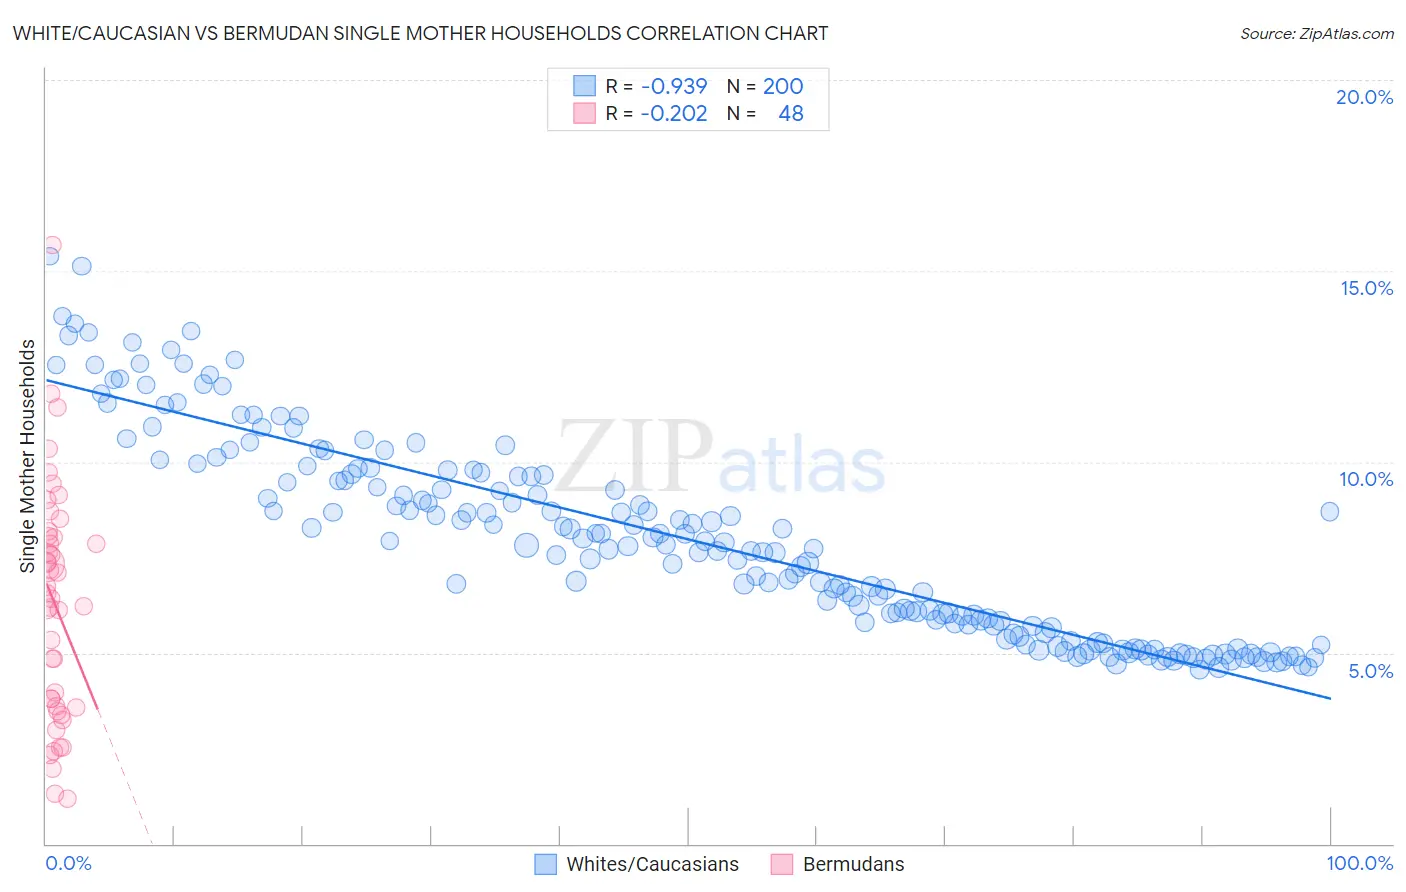
White/Caucasian vs Bermudan Single Mother Households Correlation Chart
The statistical analysis conducted on geographies consisting of 577,516,213 people shows a near-perfect negative correlation between the proportion of Whites/Caucasians and percentage of single mother households in the United States with a correlation coefficient (R) of -0.939 and weighted average of 6.1%. Similarly, the statistical analysis conducted on geographies consisting of 55,712,440 people shows a weak negative correlation between the proportion of Bermudans and percentage of single mother households in the United States with a correlation coefficient (R) of -0.202 and weighted average of 7.3%, a difference of 19.2%.
Single Mother Households Correlation Summary
| Measurement | White/Caucasian | Bermudan |
| Minimum | 4.6% | 1.2% |
| Maximum | 15.4% | 15.7% |
| Range | 10.8% | 14.5% |
| Mean | 8.0% | 6.3% |
| Median | 7.8% | 6.5% |
| Interquartile 25% (IQ1) | 5.7% | 3.6% |
| Interquartile 75% (IQ3) | 9.7% | 8.0% |
| Interquartile Range (IQR) | 4.0% | 4.5% |
| Standard Deviation (Sample) | 2.6% | 3.0% |
| Standard Deviation (Population) | 2.6% | 3.0% |
Similar Demographics by Single Mother Households
Demographics Similar to Whites/Caucasians by Single Mother Households
In terms of single mother households, the demographic groups most similar to Whites/Caucasians are Native Hawaiian (6.1%, a difference of 0.23%), Immigrants from Philippines (6.1%, a difference of 0.33%), Chilean (6.1%, a difference of 0.34%), Immigrants from Brazil (6.1%, a difference of 0.40%), and Pakistani (6.1%, a difference of 0.44%).
| Demographics | Rating | Rank | Single Mother Households |
| Scotch-Irish | 82.0 /100 | #148 | Excellent 6.0% |
| Immigrants | Albania | 81.5 /100 | #149 | Excellent 6.1% |
| Zimbabweans | 80.7 /100 | #150 | Excellent 6.1% |
| Immigrants | Southern Europe | 80.5 /100 | #151 | Excellent 6.1% |
| Pakistanis | 79.2 /100 | #152 | Good 6.1% |
| Immigrants | Brazil | 78.9 /100 | #153 | Good 6.1% |
| Immigrants | Philippines | 78.5 /100 | #154 | Good 6.1% |
| Whites/Caucasians | 76.5 /100 | #155 | Good 6.1% |
| Native Hawaiians | 75.0 /100 | #156 | Good 6.1% |
| Chileans | 74.2 /100 | #157 | Good 6.1% |
| Celtics | 73.3 /100 | #158 | Good 6.1% |
| Yugoslavians | 73.1 /100 | #159 | Good 6.1% |
| Iraqis | 73.0 /100 | #160 | Good 6.1% |
| Immigrants | Germany | 72.4 /100 | #161 | Good 6.1% |
| Immigrants | Zimbabwe | 69.9 /100 | #162 | Good 6.2% |
Demographics Similar to Bermudans by Single Mother Households
In terms of single mother households, the demographic groups most similar to Bermudans are Immigrants from Africa (7.3%, a difference of 0.010%), Spanish American Indian (7.3%, a difference of 0.29%), Dutch West Indian (7.3%, a difference of 0.32%), Malaysian (7.3%, a difference of 0.36%), and Alaskan Athabascan (7.3%, a difference of 0.38%).
| Demographics | Rating | Rank | Single Mother Households |
| Fijians | 0.6 /100 | #242 | Tragic 7.2% |
| Ecuadorians | 0.6 /100 | #243 | Tragic 7.2% |
| Cubans | 0.6 /100 | #244 | Tragic 7.2% |
| Immigrants | Cambodia | 0.5 /100 | #245 | Tragic 7.2% |
| Nicaraguans | 0.5 /100 | #246 | Tragic 7.2% |
| Dutch West Indians | 0.4 /100 | #247 | Tragic 7.3% |
| Spanish American Indians | 0.4 /100 | #248 | Tragic 7.3% |
| Bermudans | 0.4 /100 | #249 | Tragic 7.3% |
| Immigrants | Africa | 0.4 /100 | #250 | Tragic 7.3% |
| Malaysians | 0.3 /100 | #251 | Tragic 7.3% |
| Alaskan Athabascans | 0.3 /100 | #252 | Tragic 7.3% |
| Cajuns | 0.3 /100 | #253 | Tragic 7.3% |
| Immigrants | Ecuador | 0.3 /100 | #254 | Tragic 7.3% |
| Mexican American Indians | 0.2 /100 | #255 | Tragic 7.4% |
| Seminole | 0.2 /100 | #256 | Tragic 7.4% |