Welsh vs Immigrants from Mexico Male Poverty
COMPARE
Welsh
Immigrants from Mexico
Male Poverty
Male Poverty Comparison
Welsh
Immigrants from Mexico
10.5%
MALE POVERTY
91.6/ 100
METRIC RATING
104th/ 347
METRIC RANK
14.0%
MALE POVERTY
0.0/ 100
METRIC RATING
300th/ 347
METRIC RANK
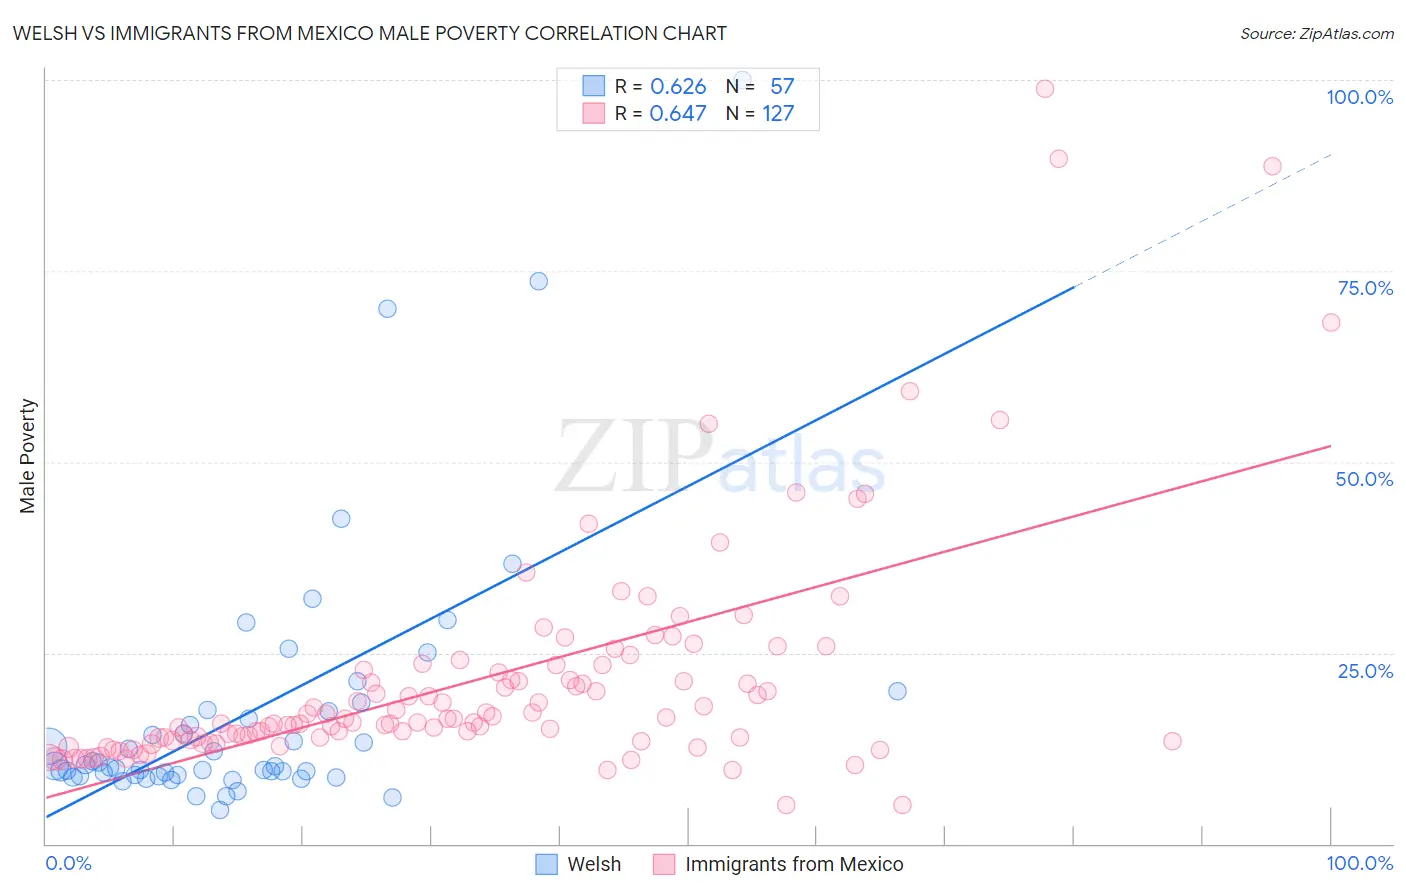
Welsh vs Immigrants from Mexico Male Poverty Correlation Chart
The statistical analysis conducted on geographies consisting of 527,618,308 people shows a significant positive correlation between the proportion of Welsh and poverty level among males in the United States with a correlation coefficient (R) of 0.626 and weighted average of 10.5%. Similarly, the statistical analysis conducted on geographies consisting of 513,064,381 people shows a significant positive correlation between the proportion of Immigrants from Mexico and poverty level among males in the United States with a correlation coefficient (R) of 0.647 and weighted average of 14.0%, a difference of 33.2%.
Male Poverty Correlation Summary
| Measurement | Welsh | Immigrants from Mexico |
| Minimum | 4.4% | 5.0% |
| Maximum | 100.0% | 98.8% |
| Range | 95.6% | 93.8% |
| Mean | 17.1% | 21.4% |
| Median | 10.1% | 15.9% |
| Interquartile 25% (IQ1) | 9.0% | 13.5% |
| Interquartile 75% (IQ3) | 17.4% | 22.7% |
| Interquartile Range (IQR) | 8.5% | 9.2% |
| Standard Deviation (Sample) | 17.4% | 15.3% |
| Standard Deviation (Population) | 17.3% | 15.2% |
Similar Demographics by Male Poverty
Demographics Similar to Welsh by Male Poverty
In terms of male poverty, the demographic groups most similar to Welsh are Slavic (10.5%, a difference of 0.010%), Canadian (10.5%, a difference of 0.010%), French Canadian (10.5%, a difference of 0.11%), Immigrants from Zimbabwe (10.5%, a difference of 0.12%), and Immigrants from Southern Europe (10.5%, a difference of 0.12%).
| Demographics | Rating | Rank | Male Poverty |
| Romanians | 93.6 /100 | #97 | Exceptional 10.5% |
| Finns | 93.4 /100 | #98 | Exceptional 10.5% |
| Immigrants | Indonesia | 93.3 /100 | #99 | Exceptional 10.5% |
| Immigrants | Latvia | 92.8 /100 | #100 | Exceptional 10.5% |
| Immigrants | Zimbabwe | 92.0 /100 | #101 | Exceptional 10.5% |
| French Canadians | 91.9 /100 | #102 | Exceptional 10.5% |
| Slavs | 91.7 /100 | #103 | Exceptional 10.5% |
| Welsh | 91.6 /100 | #104 | Exceptional 10.5% |
| Canadians | 91.6 /100 | #105 | Exceptional 10.5% |
| Immigrants | Southern Europe | 91.3 /100 | #106 | Exceptional 10.5% |
| Laotians | 91.2 /100 | #107 | Exceptional 10.5% |
| Portuguese | 91.0 /100 | #108 | Exceptional 10.6% |
| Albanians | 90.6 /100 | #109 | Exceptional 10.6% |
| Argentineans | 90.1 /100 | #110 | Exceptional 10.6% |
| Immigrants | Argentina | 89.8 /100 | #111 | Excellent 10.6% |
Demographics Similar to Immigrants from Mexico by Male Poverty
In terms of male poverty, the demographic groups most similar to Immigrants from Mexico are Immigrants from Senegal (14.0%, a difference of 0.070%), Immigrants from Guatemala (14.0%, a difference of 0.12%), Immigrants from Caribbean (14.0%, a difference of 0.13%), Bahamian (14.1%, a difference of 0.17%), and Blackfeet (14.0%, a difference of 0.22%).
| Demographics | Rating | Rank | Male Poverty |
| Immigrants | Belize | 0.0 /100 | #293 | Tragic 13.8% |
| Hispanics or Latinos | 0.0 /100 | #294 | Tragic 13.9% |
| Immigrants | Central America | 0.0 /100 | #295 | Tragic 13.9% |
| Cajuns | 0.0 /100 | #296 | Tragic 13.9% |
| Inupiat | 0.0 /100 | #297 | Tragic 14.0% |
| Blackfeet | 0.0 /100 | #298 | Tragic 14.0% |
| Immigrants | Guatemala | 0.0 /100 | #299 | Tragic 14.0% |
| Immigrants | Mexico | 0.0 /100 | #300 | Tragic 14.0% |
| Immigrants | Senegal | 0.0 /100 | #301 | Tragic 14.0% |
| Immigrants | Caribbean | 0.0 /100 | #302 | Tragic 14.0% |
| Bahamians | 0.0 /100 | #303 | Tragic 14.1% |
| Senegalese | 0.0 /100 | #304 | Tragic 14.1% |
| Immigrants | Bangladesh | 0.0 /100 | #305 | Tragic 14.1% |
| Creek | 0.0 /100 | #306 | Tragic 14.1% |
| Dutch West Indians | 0.0 /100 | #307 | Tragic 14.2% |