Welsh vs Immigrants Male Poverty
COMPARE
Welsh
Immigrants
Male Poverty
Male Poverty Comparison
Welsh
Immigrants
10.5%
MALE POVERTY
91.6/ 100
METRIC RATING
104th/ 347
METRIC RANK
12.0%
MALE POVERTY
4.5/ 100
METRIC RATING
208th/ 347
METRIC RANK
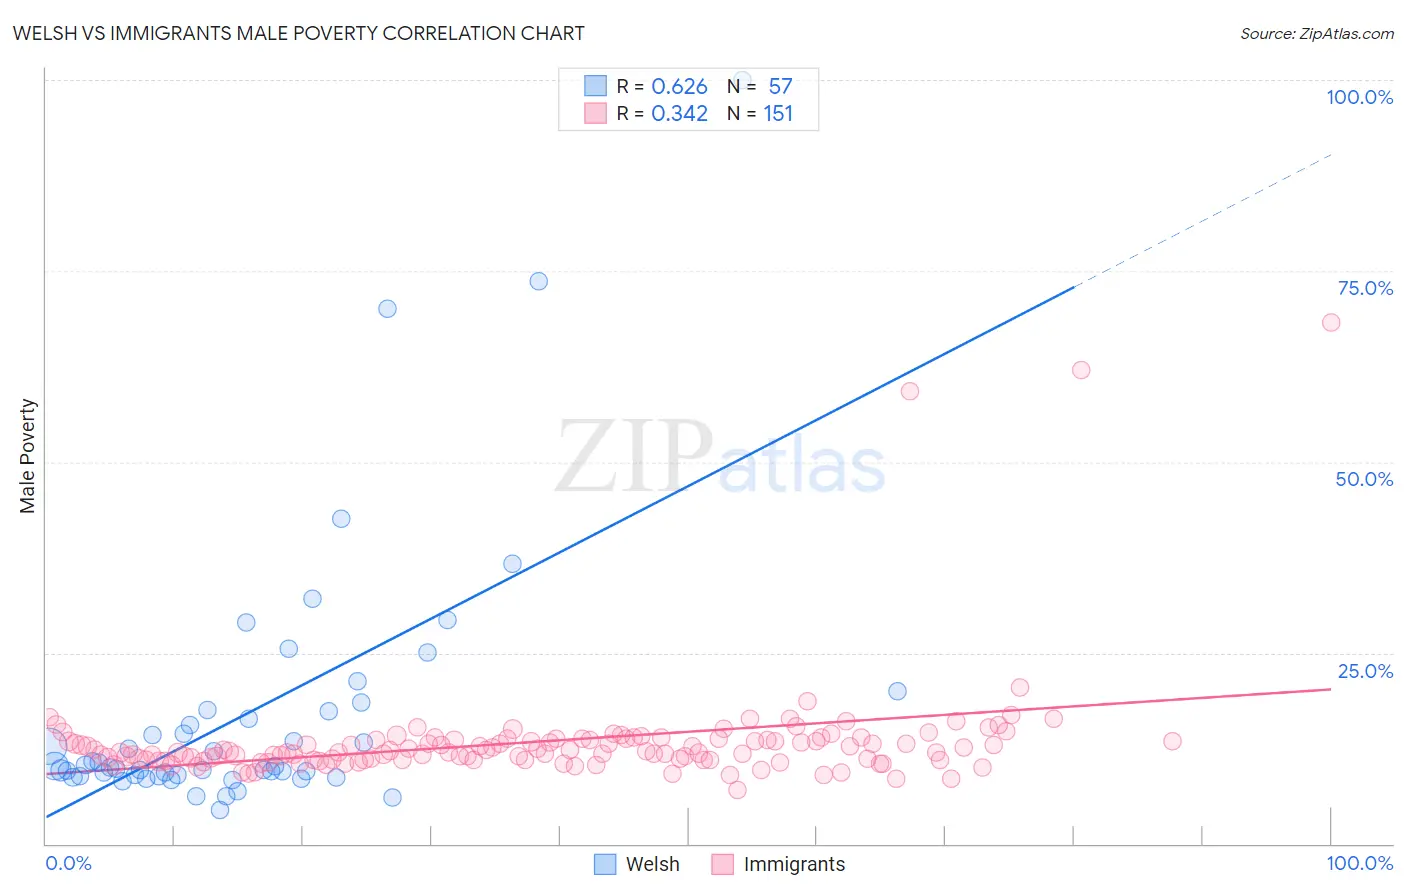
Welsh vs Immigrants Male Poverty Correlation Chart
The statistical analysis conducted on geographies consisting of 527,618,308 people shows a significant positive correlation between the proportion of Welsh and poverty level among males in the United States with a correlation coefficient (R) of 0.626 and weighted average of 10.5%. Similarly, the statistical analysis conducted on geographies consisting of 575,955,105 people shows a mild positive correlation between the proportion of Immigrants and poverty level among males in the United States with a correlation coefficient (R) of 0.342 and weighted average of 12.0%, a difference of 14.2%.
Male Poverty Correlation Summary
| Measurement | Welsh | Immigrants |
| Minimum | 4.4% | 7.0% |
| Maximum | 100.0% | 68.2% |
| Range | 95.6% | 61.1% |
| Mean | 17.1% | 13.4% |
| Median | 10.1% | 12.0% |
| Interquartile 25% (IQ1) | 9.0% | 11.0% |
| Interquartile 75% (IQ3) | 17.4% | 13.6% |
| Interquartile Range (IQR) | 8.5% | 2.6% |
| Standard Deviation (Sample) | 17.4% | 7.4% |
| Standard Deviation (Population) | 17.3% | 7.4% |
Similar Demographics by Male Poverty
Demographics Similar to Welsh by Male Poverty
In terms of male poverty, the demographic groups most similar to Welsh are Slavic (10.5%, a difference of 0.010%), Canadian (10.5%, a difference of 0.010%), French Canadian (10.5%, a difference of 0.11%), Immigrants from Zimbabwe (10.5%, a difference of 0.12%), and Immigrants from Southern Europe (10.5%, a difference of 0.12%).
| Demographics | Rating | Rank | Male Poverty |
| Romanians | 93.6 /100 | #97 | Exceptional 10.5% |
| Finns | 93.4 /100 | #98 | Exceptional 10.5% |
| Immigrants | Indonesia | 93.3 /100 | #99 | Exceptional 10.5% |
| Immigrants | Latvia | 92.8 /100 | #100 | Exceptional 10.5% |
| Immigrants | Zimbabwe | 92.0 /100 | #101 | Exceptional 10.5% |
| French Canadians | 91.9 /100 | #102 | Exceptional 10.5% |
| Slavs | 91.7 /100 | #103 | Exceptional 10.5% |
| Welsh | 91.6 /100 | #104 | Exceptional 10.5% |
| Canadians | 91.6 /100 | #105 | Exceptional 10.5% |
| Immigrants | Southern Europe | 91.3 /100 | #106 | Exceptional 10.5% |
| Laotians | 91.2 /100 | #107 | Exceptional 10.5% |
| Portuguese | 91.0 /100 | #108 | Exceptional 10.6% |
| Albanians | 90.6 /100 | #109 | Exceptional 10.6% |
| Argentineans | 90.1 /100 | #110 | Exceptional 10.6% |
| Immigrants | Argentina | 89.8 /100 | #111 | Excellent 10.6% |
Demographics Similar to Immigrants by Male Poverty
In terms of male poverty, the demographic groups most similar to Immigrants are Immigrants from the Azores (12.0%, a difference of 0.12%), Moroccan (12.0%, a difference of 0.17%), Immigrants from Panama (12.1%, a difference of 0.29%), Malaysian (12.0%, a difference of 0.33%), and Immigrants from Eastern Africa (12.0%, a difference of 0.43%).
| Demographics | Rating | Rank | Male Poverty |
| Spaniards | 13.5 /100 | #201 | Poor 11.7% |
| Aleuts | 10.4 /100 | #202 | Poor 11.8% |
| Immigrants | Western Asia | 9.8 /100 | #203 | Tragic 11.8% |
| Immigrants | Uganda | 8.5 /100 | #204 | Tragic 11.8% |
| Panamanians | 6.2 /100 | #205 | Tragic 11.9% |
| Immigrants | Eastern Africa | 5.4 /100 | #206 | Tragic 12.0% |
| Malaysians | 5.2 /100 | #207 | Tragic 12.0% |
| Immigrants | Immigrants | 4.5 /100 | #208 | Tragic 12.0% |
| Immigrants | Azores | 4.3 /100 | #209 | Tragic 12.0% |
| Moroccans | 4.2 /100 | #210 | Tragic 12.0% |
| Immigrants | Panama | 4.0 /100 | #211 | Tragic 12.1% |
| Americans | 3.2 /100 | #212 | Tragic 12.1% |
| Immigrants | Nonimmigrants | 3.1 /100 | #213 | Tragic 12.1% |
| Japanese | 2.7 /100 | #214 | Tragic 12.2% |
| Immigrants | Uzbekistan | 2.6 /100 | #215 | Tragic 12.2% |