Welsh vs Japanese Male Poverty
COMPARE
Welsh
Japanese
Male Poverty
Male Poverty Comparison
Welsh
Japanese
10.5%
MALE POVERTY
91.6/ 100
METRIC RATING
104th/ 347
METRIC RANK
12.2%
MALE POVERTY
2.7/ 100
METRIC RATING
214th/ 347
METRIC RANK
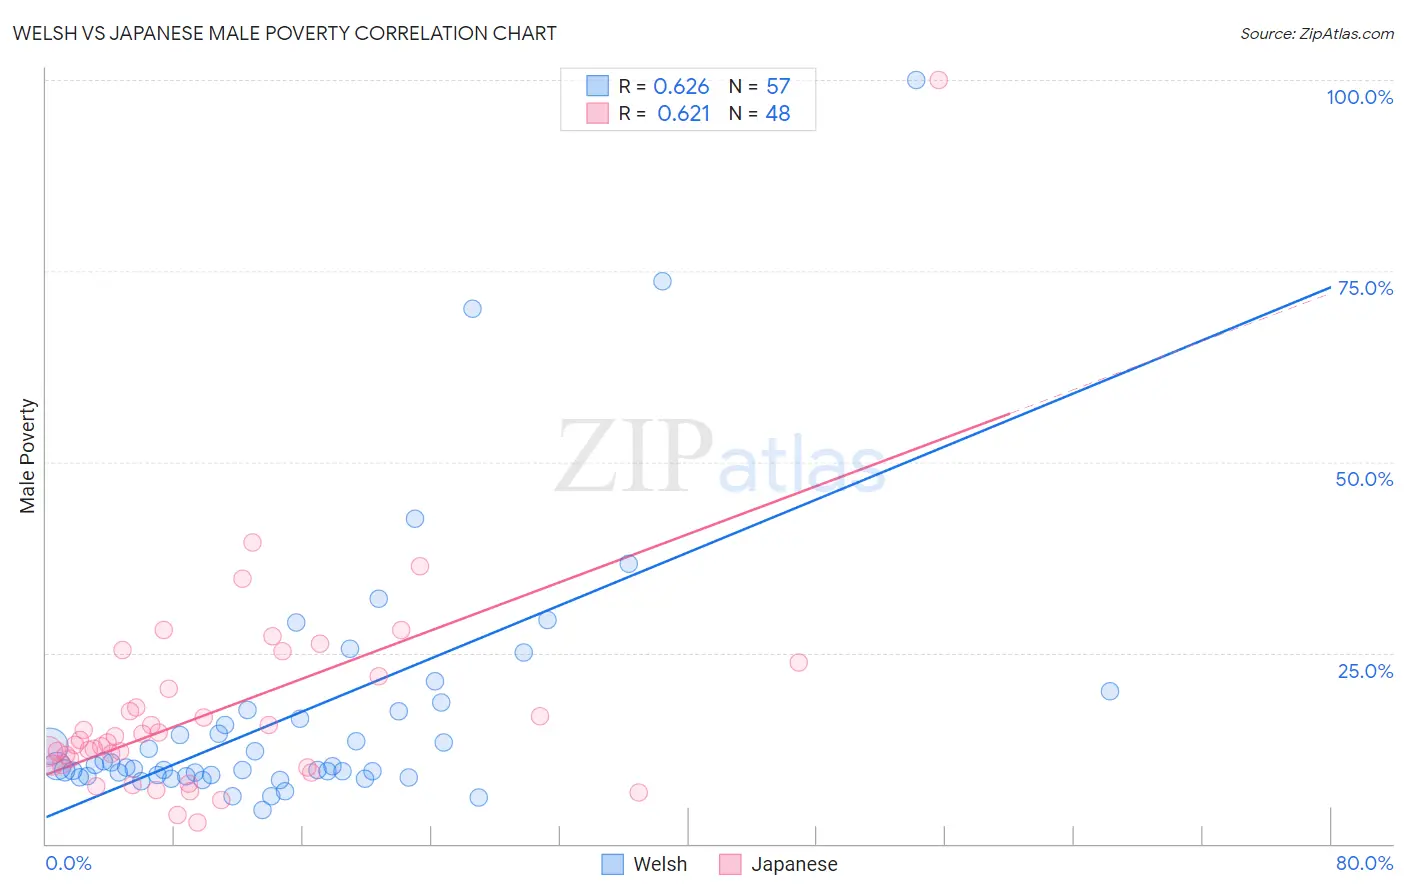
Welsh vs Japanese Male Poverty Correlation Chart
The statistical analysis conducted on geographies consisting of 527,618,308 people shows a significant positive correlation between the proportion of Welsh and poverty level among males in the United States with a correlation coefficient (R) of 0.626 and weighted average of 10.5%. Similarly, the statistical analysis conducted on geographies consisting of 249,058,138 people shows a significant positive correlation between the proportion of Japanese and poverty level among males in the United States with a correlation coefficient (R) of 0.621 and weighted average of 12.2%, a difference of 15.5%.
Male Poverty Correlation Summary
| Measurement | Welsh | Japanese |
| Minimum | 4.4% | 2.8% |
| Maximum | 100.0% | 100.0% |
| Range | 95.6% | 97.2% |
| Mean | 17.1% | 17.5% |
| Median | 10.1% | 13.3% |
| Interquartile 25% (IQ1) | 9.0% | 10.3% |
| Interquartile 75% (IQ3) | 17.4% | 21.2% |
| Interquartile Range (IQR) | 8.5% | 10.9% |
| Standard Deviation (Sample) | 17.4% | 14.8% |
| Standard Deviation (Population) | 17.3% | 14.6% |
Similar Demographics by Male Poverty
Demographics Similar to Welsh by Male Poverty
In terms of male poverty, the demographic groups most similar to Welsh are Slavic (10.5%, a difference of 0.010%), Canadian (10.5%, a difference of 0.010%), French Canadian (10.5%, a difference of 0.11%), Immigrants from Zimbabwe (10.5%, a difference of 0.12%), and Immigrants from Southern Europe (10.5%, a difference of 0.12%).
| Demographics | Rating | Rank | Male Poverty |
| Romanians | 93.6 /100 | #97 | Exceptional 10.5% |
| Finns | 93.4 /100 | #98 | Exceptional 10.5% |
| Immigrants | Indonesia | 93.3 /100 | #99 | Exceptional 10.5% |
| Immigrants | Latvia | 92.8 /100 | #100 | Exceptional 10.5% |
| Immigrants | Zimbabwe | 92.0 /100 | #101 | Exceptional 10.5% |
| French Canadians | 91.9 /100 | #102 | Exceptional 10.5% |
| Slavs | 91.7 /100 | #103 | Exceptional 10.5% |
| Welsh | 91.6 /100 | #104 | Exceptional 10.5% |
| Canadians | 91.6 /100 | #105 | Exceptional 10.5% |
| Immigrants | Southern Europe | 91.3 /100 | #106 | Exceptional 10.5% |
| Laotians | 91.2 /100 | #107 | Exceptional 10.5% |
| Portuguese | 91.0 /100 | #108 | Exceptional 10.6% |
| Albanians | 90.6 /100 | #109 | Exceptional 10.6% |
| Argentineans | 90.1 /100 | #110 | Exceptional 10.6% |
| Immigrants | Argentina | 89.8 /100 | #111 | Excellent 10.6% |
Demographics Similar to Japanese by Male Poverty
In terms of male poverty, the demographic groups most similar to Japanese are Immigrants from Uzbekistan (12.2%, a difference of 0.12%), Immigrants from Cambodia (12.2%, a difference of 0.20%), Immigrants from Thailand (12.2%, a difference of 0.21%), German Russian (12.2%, a difference of 0.23%), and Bermudan (12.2%, a difference of 0.30%).
| Demographics | Rating | Rank | Male Poverty |
| Malaysians | 5.2 /100 | #207 | Tragic 12.0% |
| Immigrants | Immigrants | 4.5 /100 | #208 | Tragic 12.0% |
| Immigrants | Azores | 4.3 /100 | #209 | Tragic 12.0% |
| Moroccans | 4.2 /100 | #210 | Tragic 12.0% |
| Immigrants | Panama | 4.0 /100 | #211 | Tragic 12.1% |
| Americans | 3.2 /100 | #212 | Tragic 12.1% |
| Immigrants | Nonimmigrants | 3.1 /100 | #213 | Tragic 12.1% |
| Japanese | 2.7 /100 | #214 | Tragic 12.2% |
| Immigrants | Uzbekistan | 2.6 /100 | #215 | Tragic 12.2% |
| Immigrants | Cambodia | 2.5 /100 | #216 | Tragic 12.2% |
| Immigrants | Thailand | 2.5 /100 | #217 | Tragic 12.2% |
| German Russians | 2.5 /100 | #218 | Tragic 12.2% |
| Bermudans | 2.4 /100 | #219 | Tragic 12.2% |
| Immigrants | Eritrea | 2.4 /100 | #220 | Tragic 12.2% |
| Ugandans | 2.2 /100 | #221 | Tragic 12.2% |