Welsh vs Immigrants from Brazil Male Poverty
COMPARE
Welsh
Immigrants from Brazil
Male Poverty
Male Poverty Comparison
Welsh
Immigrants from Brazil
10.5%
MALE POVERTY
91.6/ 100
METRIC RATING
104th/ 347
METRIC RANK
10.6%
MALE POVERTY
89.0/ 100
METRIC RATING
114th/ 347
METRIC RANK
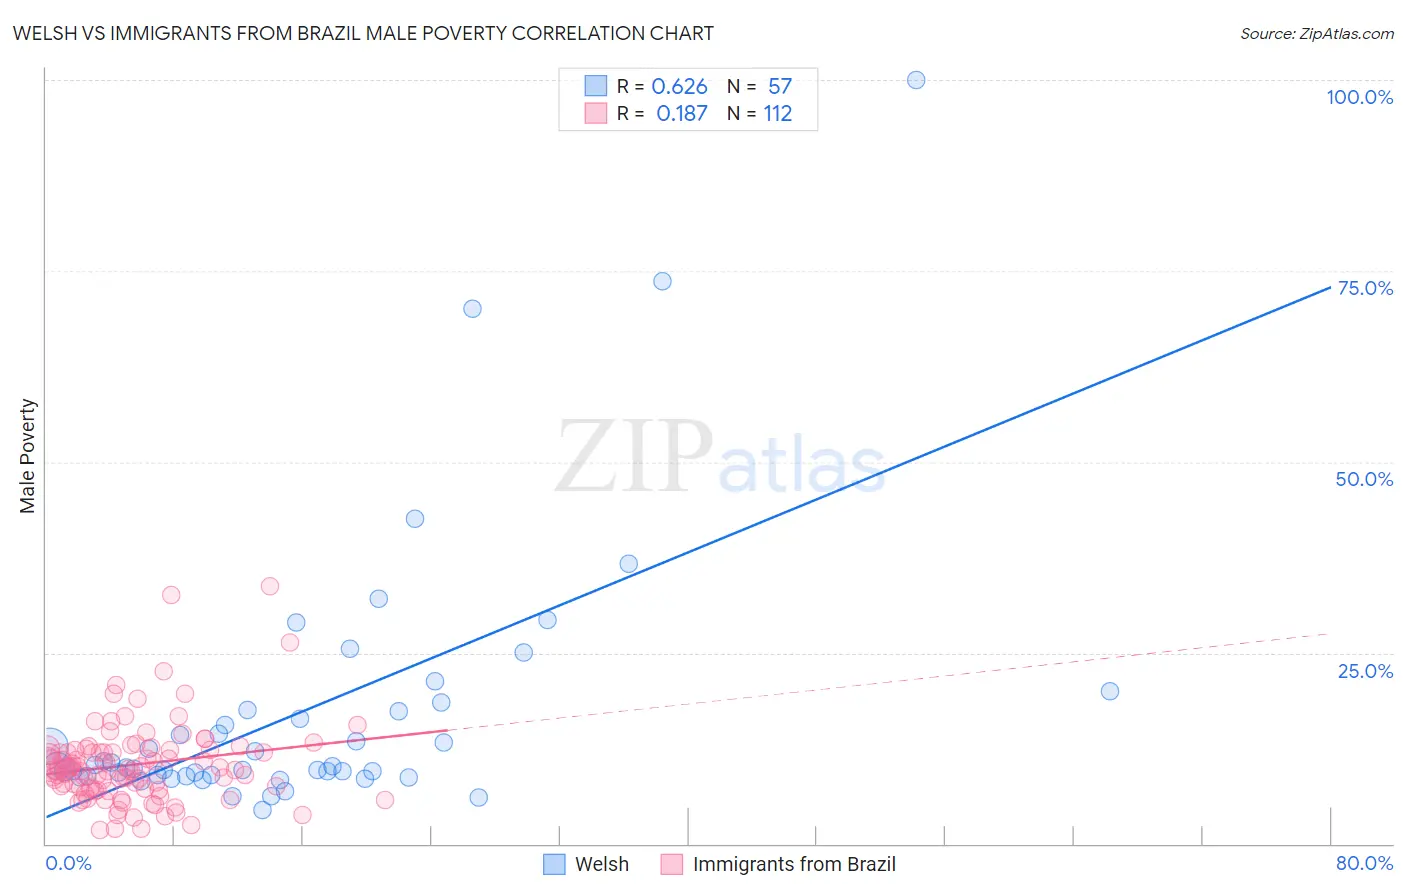
Welsh vs Immigrants from Brazil Male Poverty Correlation Chart
The statistical analysis conducted on geographies consisting of 527,618,308 people shows a significant positive correlation between the proportion of Welsh and poverty level among males in the United States with a correlation coefficient (R) of 0.626 and weighted average of 10.5%. Similarly, the statistical analysis conducted on geographies consisting of 342,783,904 people shows a poor positive correlation between the proportion of Immigrants from Brazil and poverty level among males in the United States with a correlation coefficient (R) of 0.187 and weighted average of 10.6%, a difference of 0.78%.
Male Poverty Correlation Summary
| Measurement | Welsh | Immigrants from Brazil |
| Minimum | 4.4% | 1.8% |
| Maximum | 100.0% | 33.7% |
| Range | 95.6% | 31.9% |
| Mean | 17.1% | 10.3% |
| Median | 10.1% | 9.7% |
| Interquartile 25% (IQ1) | 9.0% | 7.2% |
| Interquartile 75% (IQ3) | 17.4% | 12.3% |
| Interquartile Range (IQR) | 8.5% | 5.1% |
| Standard Deviation (Sample) | 17.4% | 5.3% |
| Standard Deviation (Population) | 17.3% | 5.3% |
Demographics Similar to Welsh and Immigrants from Brazil by Male Poverty
In terms of male poverty, the demographic groups most similar to Welsh are Slavic (10.5%, a difference of 0.010%), Canadian (10.5%, a difference of 0.010%), French Canadian (10.5%, a difference of 0.11%), Immigrants from Zimbabwe (10.5%, a difference of 0.12%), and Immigrants from Southern Europe (10.5%, a difference of 0.12%). Similarly, the demographic groups most similar to Immigrants from Brazil are Palestinian (10.6%, a difference of 0.020%), Immigrants from Turkey (10.6%, a difference of 0.12%), Immigrants from Russia (10.6%, a difference of 0.12%), Immigrants from Argentina (10.6%, a difference of 0.20%), and Sri Lankan (10.6%, a difference of 0.23%).
| Demographics | Rating | Rank | Male Poverty |
| Immigrants | Indonesia | 93.3 /100 | #99 | Exceptional 10.5% |
| Immigrants | Latvia | 92.8 /100 | #100 | Exceptional 10.5% |
| Immigrants | Zimbabwe | 92.0 /100 | #101 | Exceptional 10.5% |
| French Canadians | 91.9 /100 | #102 | Exceptional 10.5% |
| Slavs | 91.7 /100 | #103 | Exceptional 10.5% |
| Welsh | 91.6 /100 | #104 | Exceptional 10.5% |
| Canadians | 91.6 /100 | #105 | Exceptional 10.5% |
| Immigrants | Southern Europe | 91.3 /100 | #106 | Exceptional 10.5% |
| Laotians | 91.2 /100 | #107 | Exceptional 10.5% |
| Portuguese | 91.0 /100 | #108 | Exceptional 10.6% |
| Albanians | 90.6 /100 | #109 | Exceptional 10.6% |
| Argentineans | 90.1 /100 | #110 | Exceptional 10.6% |
| Immigrants | Argentina | 89.8 /100 | #111 | Excellent 10.6% |
| Immigrants | Turkey | 89.5 /100 | #112 | Excellent 10.6% |
| Palestinians | 89.1 /100 | #113 | Excellent 10.6% |
| Immigrants | Brazil | 89.0 /100 | #114 | Excellent 10.6% |
| Immigrants | Russia | 88.6 /100 | #115 | Excellent 10.6% |
| Sri Lankans | 88.1 /100 | #116 | Excellent 10.6% |
| Immigrants | South Eastern Asia | 88.1 /100 | #117 | Excellent 10.6% |
| Okinawans | 87.6 /100 | #118 | Excellent 10.7% |
| Immigrants | Hungary | 87.6 /100 | #119 | Excellent 10.7% |