Ute vs Puerto Rican Single Male Poverty
COMPARE
Ute
Puerto Rican
Single Male Poverty
Single Male Poverty Comparison
Ute
Puerto Ricans
15.7%
SINGLE MALE POVERTY
0.0/ 100
METRIC RATING
307th/ 347
METRIC RANK
25.1%
SINGLE MALE POVERTY
0.0/ 100
METRIC RATING
343rd/ 347
METRIC RANK
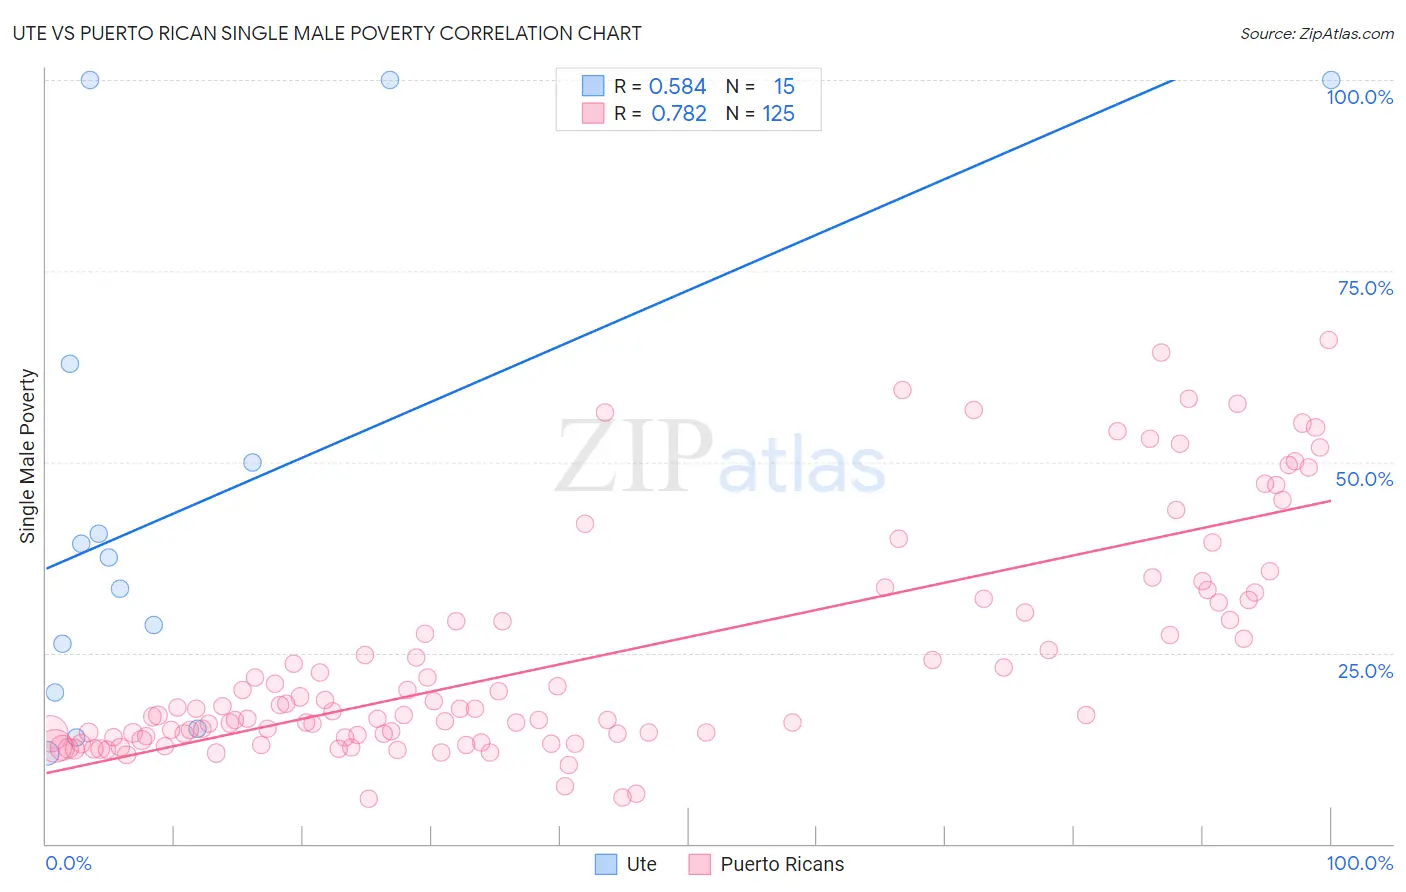
Ute vs Puerto Rican Single Male Poverty Correlation Chart
The statistical analysis conducted on geographies consisting of 54,243,903 people shows a substantial positive correlation between the proportion of Ute and poverty level among single males in the United States with a correlation coefficient (R) of 0.584 and weighted average of 15.7%. Similarly, the statistical analysis conducted on geographies consisting of 451,233,514 people shows a strong positive correlation between the proportion of Puerto Ricans and poverty level among single males in the United States with a correlation coefficient (R) of 0.782 and weighted average of 25.1%, a difference of 59.9%.
Single Male Poverty Correlation Summary
| Measurement | Ute | Puerto Rican |
| Minimum | 11.8% | 5.9% |
| Maximum | 100.0% | 66.0% |
| Range | 88.2% | 60.0% |
| Mean | 45.2% | 24.3% |
| Median | 37.4% | 17.6% |
| Interquartile 25% (IQ1) | 19.9% | 14.2% |
| Interquartile 75% (IQ3) | 62.8% | 31.7% |
| Interquartile Range (IQR) | 42.9% | 17.6% |
| Standard Deviation (Sample) | 31.5% | 14.8% |
| Standard Deviation (Population) | 30.4% | 14.8% |
Similar Demographics by Single Male Poverty
Demographics Similar to Ute by Single Male Poverty
In terms of single male poverty, the demographic groups most similar to Ute are Potawatomi (15.8%, a difference of 0.57%), American (15.8%, a difference of 0.73%), Pennsylvania German (15.6%, a difference of 0.75%), Blackfeet (15.5%, a difference of 1.2%), and Yakama (15.9%, a difference of 1.6%).
| Demographics | Rating | Rank | Single Male Poverty |
| Cree | 0.0 /100 | #300 | Tragic 15.1% |
| Dominicans | 0.0 /100 | #301 | Tragic 15.2% |
| Alsatians | 0.0 /100 | #302 | Tragic 15.2% |
| Aleuts | 0.0 /100 | #303 | Tragic 15.4% |
| Alaska Natives | 0.0 /100 | #304 | Tragic 15.4% |
| Blackfeet | 0.0 /100 | #305 | Tragic 15.5% |
| Pennsylvania Germans | 0.0 /100 | #306 | Tragic 15.6% |
| Ute | 0.0 /100 | #307 | Tragic 15.7% |
| Potawatomi | 0.0 /100 | #308 | Tragic 15.8% |
| Americans | 0.0 /100 | #309 | Tragic 15.8% |
| Yakama | 0.0 /100 | #310 | Tragic 15.9% |
| Seminole | 0.0 /100 | #311 | Tragic 16.0% |
| Comanche | 0.0 /100 | #312 | Tragic 16.0% |
| Cherokee | 0.0 /100 | #313 | Tragic 16.1% |
| Alaskan Athabascans | 0.0 /100 | #314 | Tragic 16.1% |
Demographics Similar to Puerto Ricans by Single Male Poverty
In terms of single male poverty, the demographic groups most similar to Puerto Ricans are Lumbee (25.2%, a difference of 0.31%), Navajo (25.3%, a difference of 1.1%), Houma (23.5%, a difference of 6.9%), Crow (23.3%, a difference of 7.8%), and Hopi (27.5%, a difference of 9.7%).
| Demographics | Rating | Rank | Single Male Poverty |
| Inupiat | 0.0 /100 | #333 | Tragic 20.0% |
| Pima | 0.0 /100 | #334 | Tragic 20.2% |
| Yuman | 0.0 /100 | #335 | Tragic 21.3% |
| Tohono O'odham | 0.0 /100 | #336 | Tragic 21.6% |
| Apache | 0.0 /100 | #337 | Tragic 21.6% |
| Pueblo | 0.0 /100 | #338 | Tragic 21.6% |
| Arapaho | 0.0 /100 | #339 | Tragic 21.9% |
| Sioux | 0.0 /100 | #340 | Tragic 22.2% |
| Crow | 0.0 /100 | #341 | Tragic 23.3% |
| Houma | 0.0 /100 | #342 | Tragic 23.5% |
| Puerto Ricans | 0.0 /100 | #343 | Tragic 25.1% |
| Lumbee | 0.0 /100 | #344 | Tragic 25.2% |
| Navajo | 0.0 /100 | #345 | Tragic 25.3% |
| Hopi | 0.0 /100 | #346 | Tragic 27.5% |
| Yup'ik | 0.0 /100 | #347 | Tragic 31.6% |