Ute vs Immigrants from Malaysia Single Male Poverty
COMPARE
Ute
Immigrants from Malaysia
Single Male Poverty
Single Male Poverty Comparison
Ute
Immigrants from Malaysia
15.7%
SINGLE MALE POVERTY
0.0/ 100
METRIC RATING
307th/ 347
METRIC RANK
12.0%
SINGLE MALE POVERTY
99.2/ 100
METRIC RATING
77th/ 347
METRIC RANK
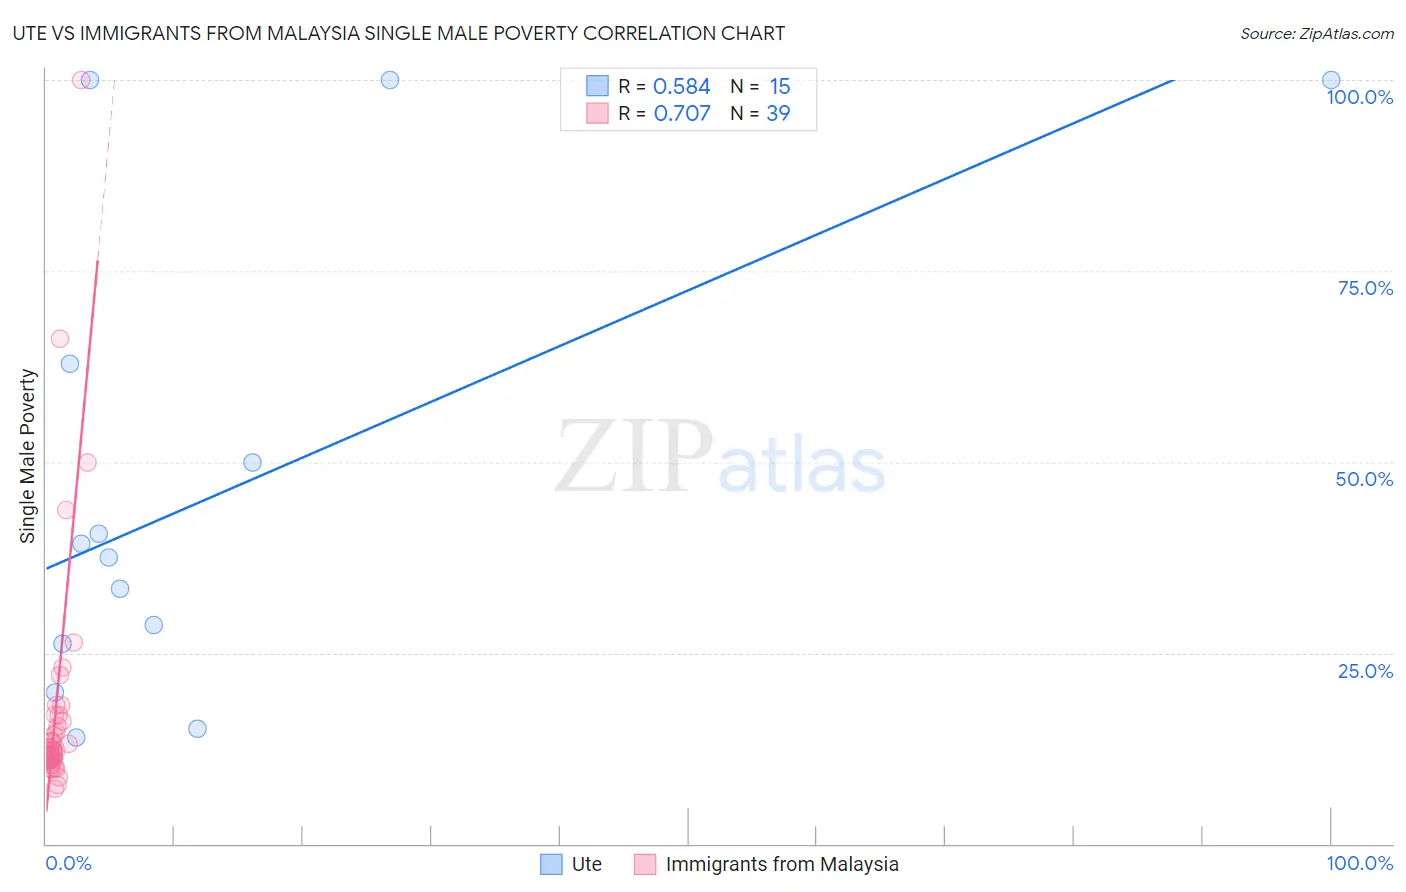
Ute vs Immigrants from Malaysia Single Male Poverty Correlation Chart
The statistical analysis conducted on geographies consisting of 54,243,903 people shows a substantial positive correlation between the proportion of Ute and poverty level among single males in the United States with a correlation coefficient (R) of 0.584 and weighted average of 15.7%. Similarly, the statistical analysis conducted on geographies consisting of 183,302,457 people shows a strong positive correlation between the proportion of Immigrants from Malaysia and poverty level among single males in the United States with a correlation coefficient (R) of 0.707 and weighted average of 12.0%, a difference of 30.9%.
Single Male Poverty Correlation Summary
| Measurement | Ute | Immigrants from Malaysia |
| Minimum | 11.8% | 7.3% |
| Maximum | 100.0% | 100.0% |
| Range | 88.2% | 92.7% |
| Mean | 45.2% | 18.6% |
| Median | 37.4% | 12.3% |
| Interquartile 25% (IQ1) | 19.9% | 11.0% |
| Interquartile 75% (IQ3) | 62.8% | 16.8% |
| Interquartile Range (IQR) | 42.9% | 5.8% |
| Standard Deviation (Sample) | 31.5% | 17.8% |
| Standard Deviation (Population) | 30.4% | 17.6% |
Similar Demographics by Single Male Poverty
Demographics Similar to Ute by Single Male Poverty
In terms of single male poverty, the demographic groups most similar to Ute are Potawatomi (15.8%, a difference of 0.57%), American (15.8%, a difference of 0.73%), Pennsylvania German (15.6%, a difference of 0.75%), Blackfeet (15.5%, a difference of 1.2%), and Yakama (15.9%, a difference of 1.6%).
| Demographics | Rating | Rank | Single Male Poverty |
| Cree | 0.0 /100 | #300 | Tragic 15.1% |
| Dominicans | 0.0 /100 | #301 | Tragic 15.2% |
| Alsatians | 0.0 /100 | #302 | Tragic 15.2% |
| Aleuts | 0.0 /100 | #303 | Tragic 15.4% |
| Alaska Natives | 0.0 /100 | #304 | Tragic 15.4% |
| Blackfeet | 0.0 /100 | #305 | Tragic 15.5% |
| Pennsylvania Germans | 0.0 /100 | #306 | Tragic 15.6% |
| Ute | 0.0 /100 | #307 | Tragic 15.7% |
| Potawatomi | 0.0 /100 | #308 | Tragic 15.8% |
| Americans | 0.0 /100 | #309 | Tragic 15.8% |
| Yakama | 0.0 /100 | #310 | Tragic 15.9% |
| Seminole | 0.0 /100 | #311 | Tragic 16.0% |
| Comanche | 0.0 /100 | #312 | Tragic 16.0% |
| Cherokee | 0.0 /100 | #313 | Tragic 16.1% |
| Alaskan Athabascans | 0.0 /100 | #314 | Tragic 16.1% |
Demographics Similar to Immigrants from Malaysia by Single Male Poverty
In terms of single male poverty, the demographic groups most similar to Immigrants from Malaysia are Immigrants from Venezuela (12.0%, a difference of 0.25%), Immigrants from Northern Africa (11.9%, a difference of 0.26%), Uruguayan (11.9%, a difference of 0.29%), Immigrants from Belgium (12.0%, a difference of 0.36%), and Chilean (11.9%, a difference of 0.48%).
| Demographics | Rating | Rank | Single Male Poverty |
| Immigrants | Nepal | 99.6 /100 | #70 | Exceptional 11.9% |
| Immigrants | Greece | 99.6 /100 | #71 | Exceptional 11.9% |
| Immigrants | Argentina | 99.5 /100 | #72 | Exceptional 11.9% |
| Argentineans | 99.5 /100 | #73 | Exceptional 11.9% |
| Chileans | 99.5 /100 | #74 | Exceptional 11.9% |
| Uruguayans | 99.4 /100 | #75 | Exceptional 11.9% |
| Immigrants | Northern Africa | 99.4 /100 | #76 | Exceptional 11.9% |
| Immigrants | Malaysia | 99.2 /100 | #77 | Exceptional 12.0% |
| Immigrants | Venezuela | 99.1 /100 | #78 | Exceptional 12.0% |
| Immigrants | Belgium | 99.0 /100 | #79 | Exceptional 12.0% |
| Armenians | 98.7 /100 | #80 | Exceptional 12.1% |
| Immigrants | South America | 98.7 /100 | #81 | Exceptional 12.1% |
| Immigrants | Colombia | 98.6 /100 | #82 | Exceptional 12.1% |
| Immigrants | Chile | 98.6 /100 | #83 | Exceptional 12.1% |
| Immigrants | Czechoslovakia | 98.6 /100 | #84 | Exceptional 12.1% |