Ute vs Immigrants from Philippines Single Male Poverty
COMPARE
Ute
Immigrants from Philippines
Single Male Poverty
Single Male Poverty Comparison
Ute
Immigrants from Philippines
15.7%
SINGLE MALE POVERTY
0.0/ 100
METRIC RATING
307th/ 347
METRIC RANK
10.9%
SINGLE MALE POVERTY
100.0/ 100
METRIC RATING
11th/ 347
METRIC RANK
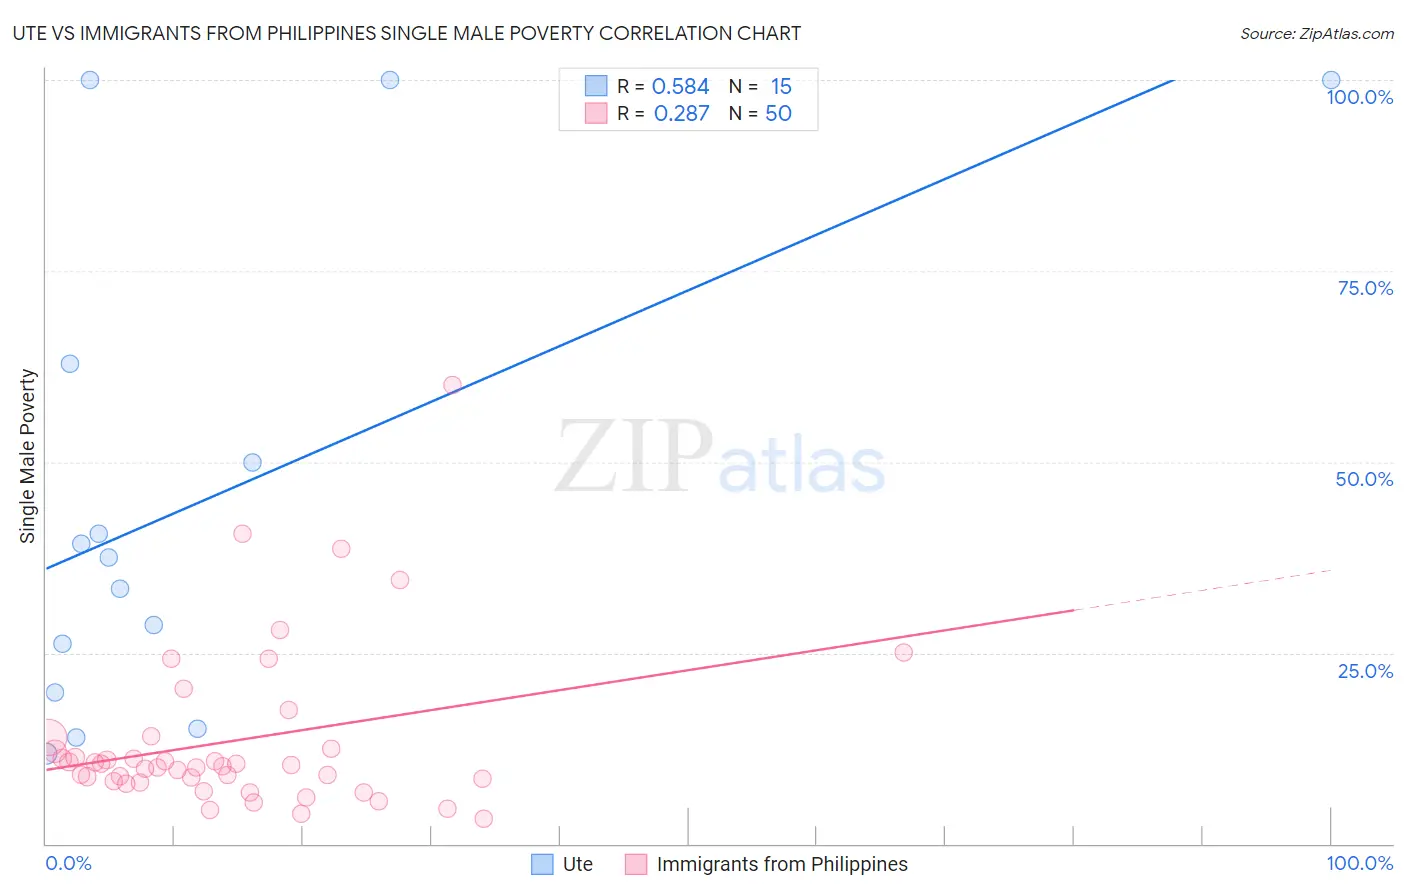
Ute vs Immigrants from Philippines Single Male Poverty Correlation Chart
The statistical analysis conducted on geographies consisting of 54,243,903 people shows a substantial positive correlation between the proportion of Ute and poverty level among single males in the United States with a correlation coefficient (R) of 0.584 and weighted average of 15.7%. Similarly, the statistical analysis conducted on geographies consisting of 410,171,646 people shows a weak positive correlation between the proportion of Immigrants from Philippines and poverty level among single males in the United States with a correlation coefficient (R) of 0.287 and weighted average of 10.9%, a difference of 43.9%.
Single Male Poverty Correlation Summary
| Measurement | Ute | Immigrants from Philippines |
| Minimum | 11.8% | 3.3% |
| Maximum | 100.0% | 60.0% |
| Range | 88.2% | 56.7% |
| Mean | 45.2% | 13.5% |
| Median | 37.4% | 10.3% |
| Interquartile 25% (IQ1) | 19.9% | 8.1% |
| Interquartile 75% (IQ3) | 62.8% | 12.5% |
| Interquartile Range (IQR) | 42.9% | 4.4% |
| Standard Deviation (Sample) | 31.5% | 10.8% |
| Standard Deviation (Population) | 30.4% | 10.6% |
Similar Demographics by Single Male Poverty
Demographics Similar to Ute by Single Male Poverty
In terms of single male poverty, the demographic groups most similar to Ute are Potawatomi (15.8%, a difference of 0.57%), American (15.8%, a difference of 0.73%), Pennsylvania German (15.6%, a difference of 0.75%), Blackfeet (15.5%, a difference of 1.2%), and Yakama (15.9%, a difference of 1.6%).
| Demographics | Rating | Rank | Single Male Poverty |
| Cree | 0.0 /100 | #300 | Tragic 15.1% |
| Dominicans | 0.0 /100 | #301 | Tragic 15.2% |
| Alsatians | 0.0 /100 | #302 | Tragic 15.2% |
| Aleuts | 0.0 /100 | #303 | Tragic 15.4% |
| Alaska Natives | 0.0 /100 | #304 | Tragic 15.4% |
| Blackfeet | 0.0 /100 | #305 | Tragic 15.5% |
| Pennsylvania Germans | 0.0 /100 | #306 | Tragic 15.6% |
| Ute | 0.0 /100 | #307 | Tragic 15.7% |
| Potawatomi | 0.0 /100 | #308 | Tragic 15.8% |
| Americans | 0.0 /100 | #309 | Tragic 15.8% |
| Yakama | 0.0 /100 | #310 | Tragic 15.9% |
| Seminole | 0.0 /100 | #311 | Tragic 16.0% |
| Comanche | 0.0 /100 | #312 | Tragic 16.0% |
| Cherokee | 0.0 /100 | #313 | Tragic 16.1% |
| Alaskan Athabascans | 0.0 /100 | #314 | Tragic 16.1% |
Demographics Similar to Immigrants from Philippines by Single Male Poverty
In terms of single male poverty, the demographic groups most similar to Immigrants from Philippines are Immigrants from Fiji (10.9%, a difference of 0.020%), Taiwanese (10.9%, a difference of 0.070%), Immigrants from Afghanistan (10.9%, a difference of 0.070%), Immigrants from South Central Asia (10.9%, a difference of 0.20%), and Chinese (11.0%, a difference of 0.76%).
| Demographics | Rating | Rank | Single Male Poverty |
| Immigrants | Hong Kong | 100.0 /100 | #4 | Exceptional 10.4% |
| Tongans | 100.0 /100 | #5 | Exceptional 10.5% |
| Filipinos | 100.0 /100 | #6 | Exceptional 10.6% |
| Afghans | 100.0 /100 | #7 | Exceptional 10.7% |
| Thais | 100.0 /100 | #8 | Exceptional 10.8% |
| Taiwanese | 100.0 /100 | #9 | Exceptional 10.9% |
| Immigrants | Fiji | 100.0 /100 | #10 | Exceptional 10.9% |
| Immigrants | Philippines | 100.0 /100 | #11 | Exceptional 10.9% |
| Immigrants | Afghanistan | 100.0 /100 | #12 | Exceptional 10.9% |
| Immigrants | South Central Asia | 100.0 /100 | #13 | Exceptional 10.9% |
| Chinese | 100.0 /100 | #14 | Exceptional 11.0% |
| Koreans | 100.0 /100 | #15 | Exceptional 11.0% |
| Bhutanese | 100.0 /100 | #16 | Exceptional 11.1% |
| Tsimshian | 100.0 /100 | #17 | Exceptional 11.1% |
| Immigrants | Bolivia | 100.0 /100 | #18 | Exceptional 11.1% |